Abstract
There is considerable excitement surrounding the treatment potential of T cell immunotherapies. Despite the clinical success of chimeric antigen receptor (CAR) T cells, there remain challenges associated with routinely offering these products as treatment alternatives. These challenges include the costly manufacturing process relying on lengthy and complex open workflows with high manual labor requirements that influence product variability.
This article describes the details of a robust CAR T cell manufacturing workflow that can be adapted for current good manufacturing practices (cGMP) compliance in commercial production of CAR T cells. This semi-automated, closed CAR T process achieves 1 × 10¹⁰ expanded T cells. Enhanced green fluorescent protein (eGFP) transduction efficiency is greater than 80% across an 8-day manufacturing process.
Introduction
In 2023 alone, an estimated 1.9 million new cases of cancer are expected to be diagnosed in the US, and about 600 000 Americans are expected to die of cancer—equivalent to 1670 deaths per day (1). Although chemotherapy combined with drugs continues to be the standard of care, an increasing number of adults and children are refractory to conventional treatment modalities, motivating the “next generation” of approaches for cancer therapy.
Unlike conventional chemotherapy, novel approaches are now being developed based on a deeper understanding of immuno-oncology. Among these approaches, adoptive T cell therapy has gained significant attention for its curative potential. Approval of autologous CAR T cell therapies from Novartis (Kymriah™) and Gilead/Kite (Yescarta™) (2) underscores both the promise and challenges ahead in order to make these therapies available to patients.
There is now a growing need for end-to-end workflow solutions supporting industrial scale-up and scale-out of CAR T cell therapies. To address these challenges, we have investigated individual CAR T unit operations to identify commercially available reagents and modular equipment that drive process closure and automation as a method to improve workflow efficiency and product consistency. The CAR T workflow is shown in Figure 1.
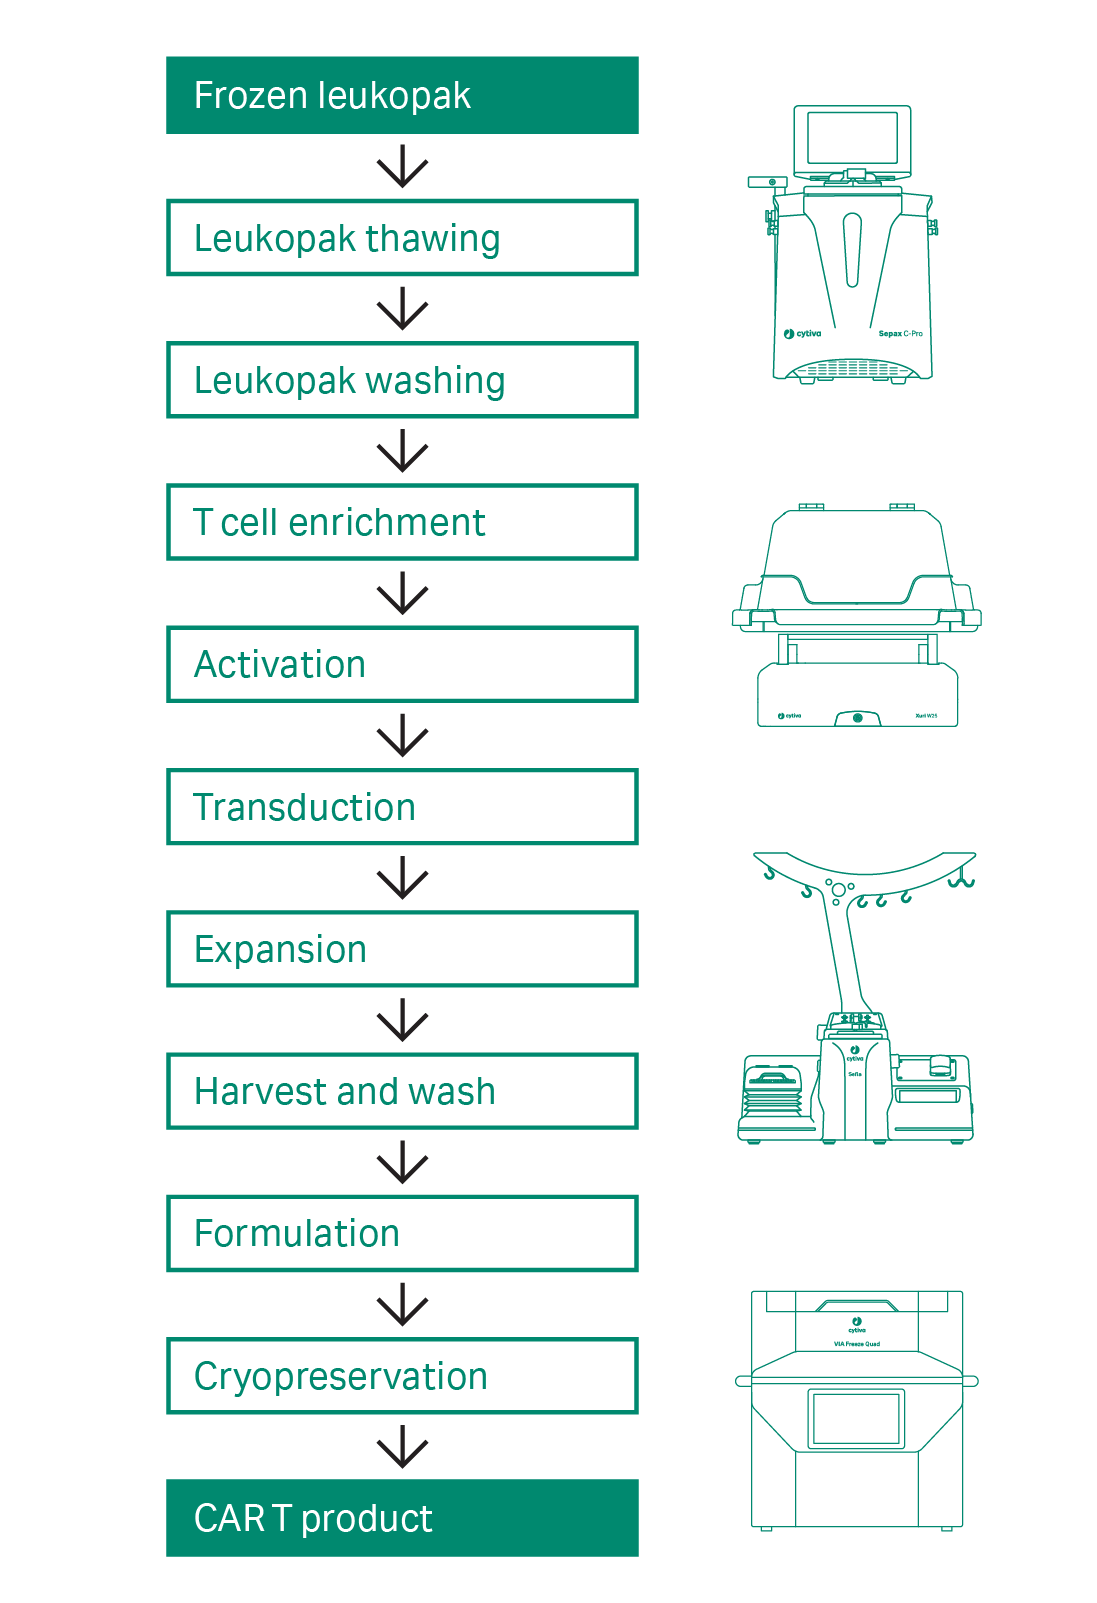
Fig 1. Workflow for the semi-automated, closed CAR T cell manufacturing process. The cell material at the start and end of the process is highlighted in green. The unit operations are shown in white.
We evaluated commercially available T cell enrichment and activation reagents, closed small-scale culture vessel options, alternative solutions to enhance transduction, and the specific timing of process steps. The aim was to develop a modular platform process that is robust and flexible for the varied needs of CAR T developers.
Detailed materials and methods are provided at the end of the article.
Results and discussion
Comparison of thawing and washing methods
Open, manual methods are available for thawing and washing cells from leukopaks. However, these do not comply with evolving GMP requirements and might introduce risks associated with operator variability and contamination. As an alternative, a closed, automated approach can be used to thaw and wash the cells. Such an approach can reduce manual labor requirements and product variability.
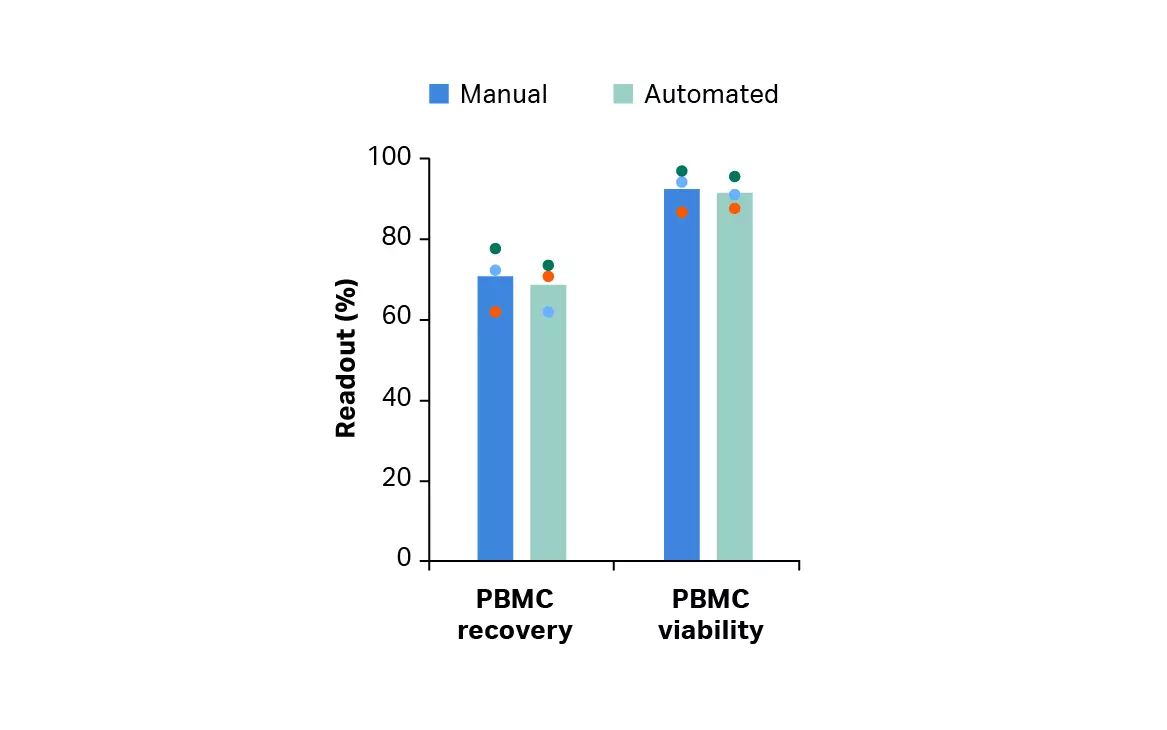
Thawing of frozen leukopaks using an automated dry thawing device*, washing using a functionally closed cell processing system† resulted in cell recovery and viability results comparable to a manual method (p ≥ 0.05 by 2-sample t-test, n = 3) (Fig 2A). Cells from the automated method also gave comparable T cell recovery, purity, and viability (p ≥ 0.05 by 2-sample t-test, n = 3) (Fig 2B).
* For upstream thawing we used a proprietary device. An alternative would be to use the VIA Thaw™ instrument for both upstream and downstream processing.
† a functionally closed cell processing device was used in this study. However, the Sepax™ C-Pro instrument is recommended as the equivalent instrument for manufacturing purposes.
(A)
(B)
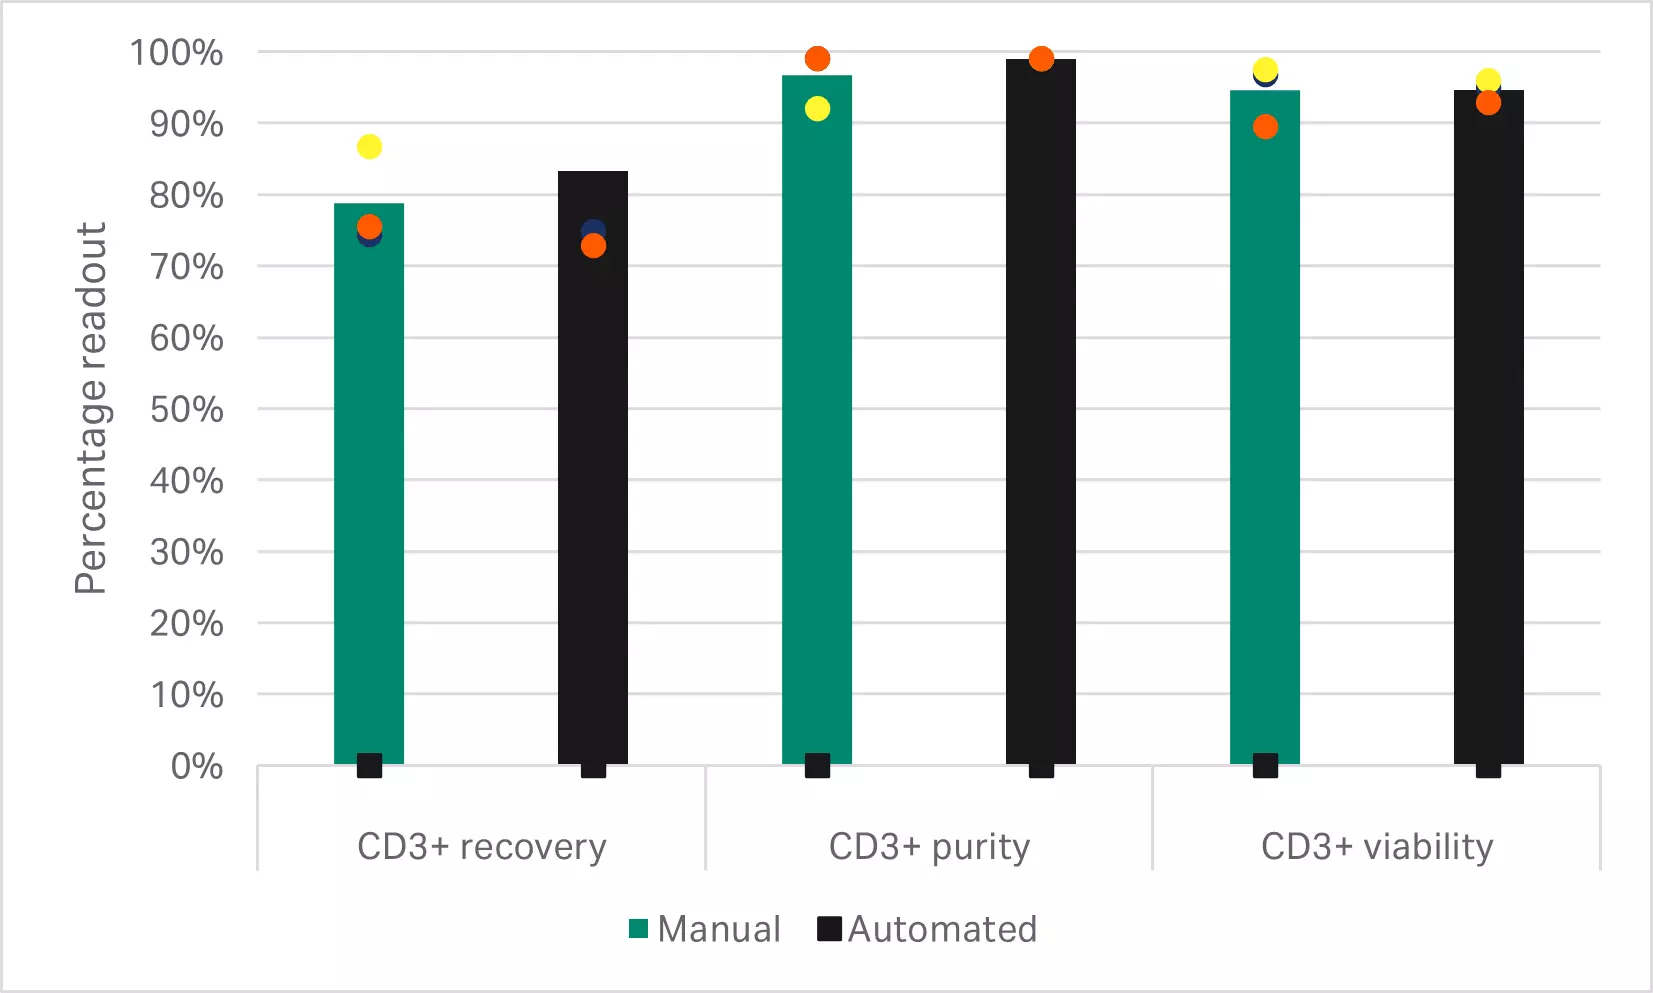
Fig 2. Recovery and viability after manual and automated thaw and wash. (A) Viable peripheral blood mononuclear cell (PBMC) recovery and viability immediately after manual or automated thaw and wash; (B) recovery, purity and viability of enriched T cells after EasySep Release Human CD3 Positive Selection. Bars represent the average of the biological triplicates with individual donor values shown by colored dots.
Comparison of T cell enrichment methods
There are several commercially available methods for enriching T cell populations. Two common systems are CD3+selection and CD14+/CD19+ depletion. In order to determine the optimal protocol for enriching T cells, two CD3+selection methods and one CD14+/CD19+ depletion method were evaluated.
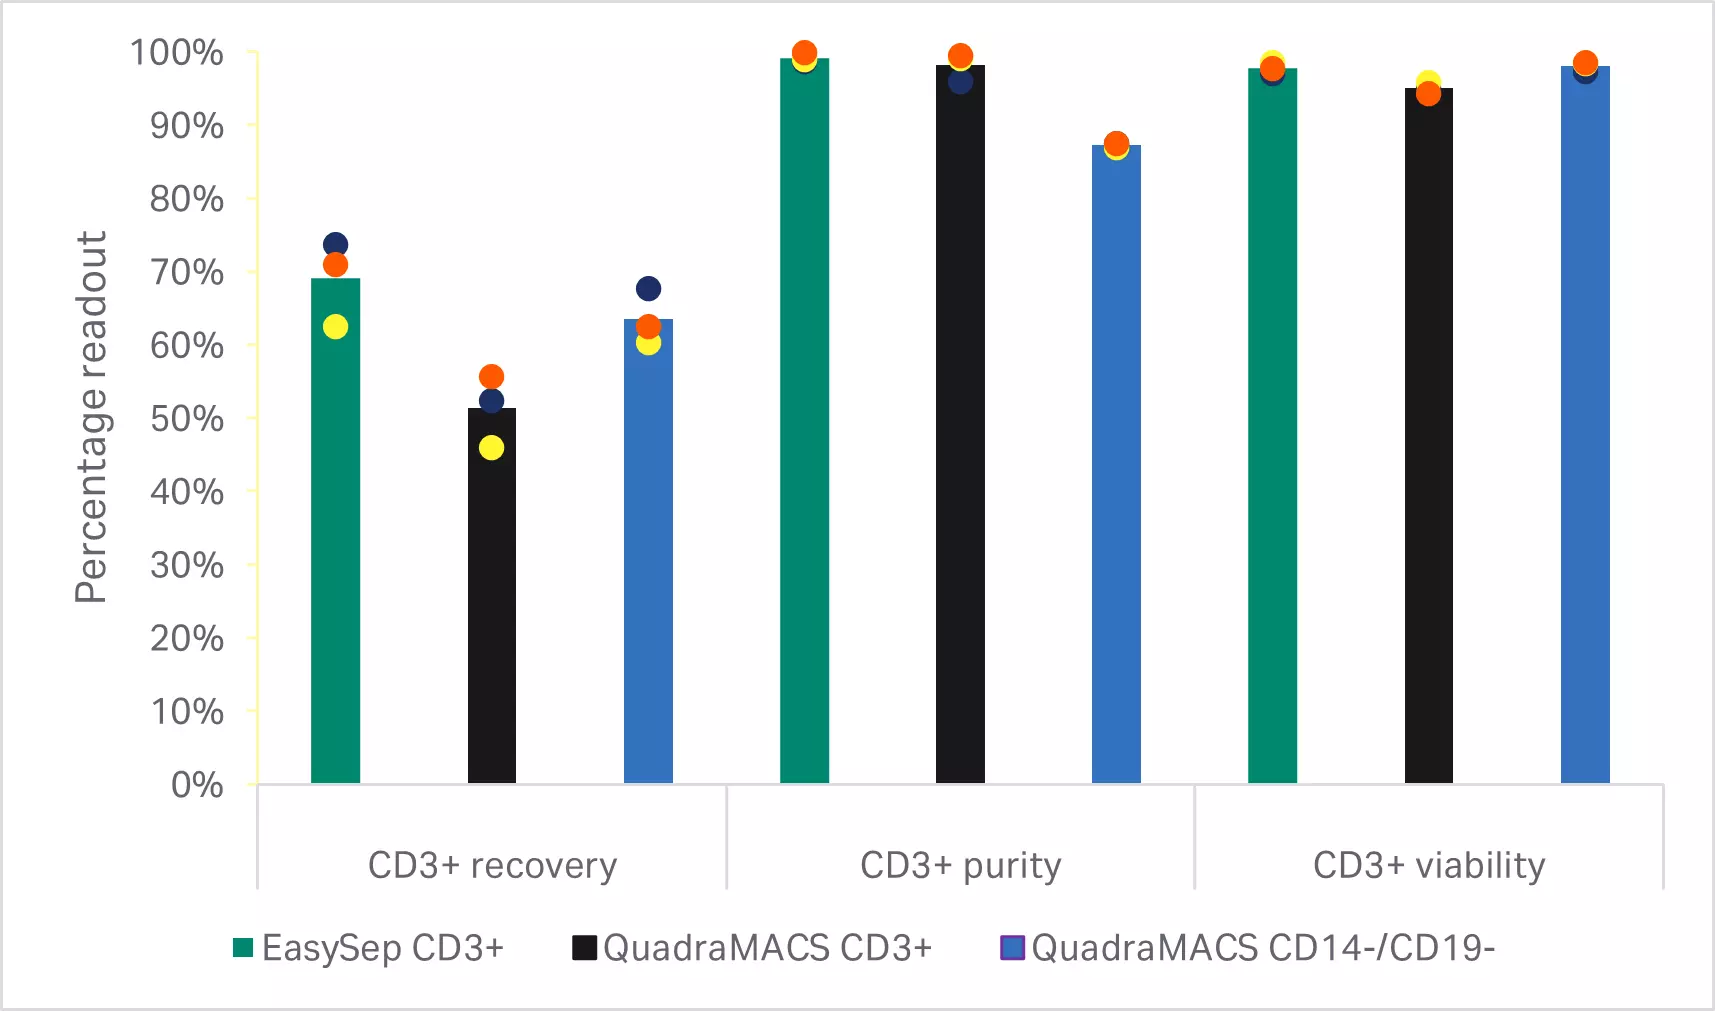
As expected, depletion of the CD14+ and CD19+populations resulted in significantly lower T cell purities than either of the CD3+selection methods (p < 0.001 by one-way ANOVA, n = 3) (Fig 3B). T cell enrichment using the EasySep™ Release Human CD3 Positive Selection Kit resulted in significantly higher recoveries than selection with the QuadroMACS™ system (p = 0.01 by one-way ANOVA, n = 3) (Fig 3B). However, there were no statistically significant differences in the viability and 5-day expansion kinetics between any of the enriched T cell populations (p ≥ 0.05 by one-way ANOVA, n=3) (Fig 3C).
(A)
(B)
(C)
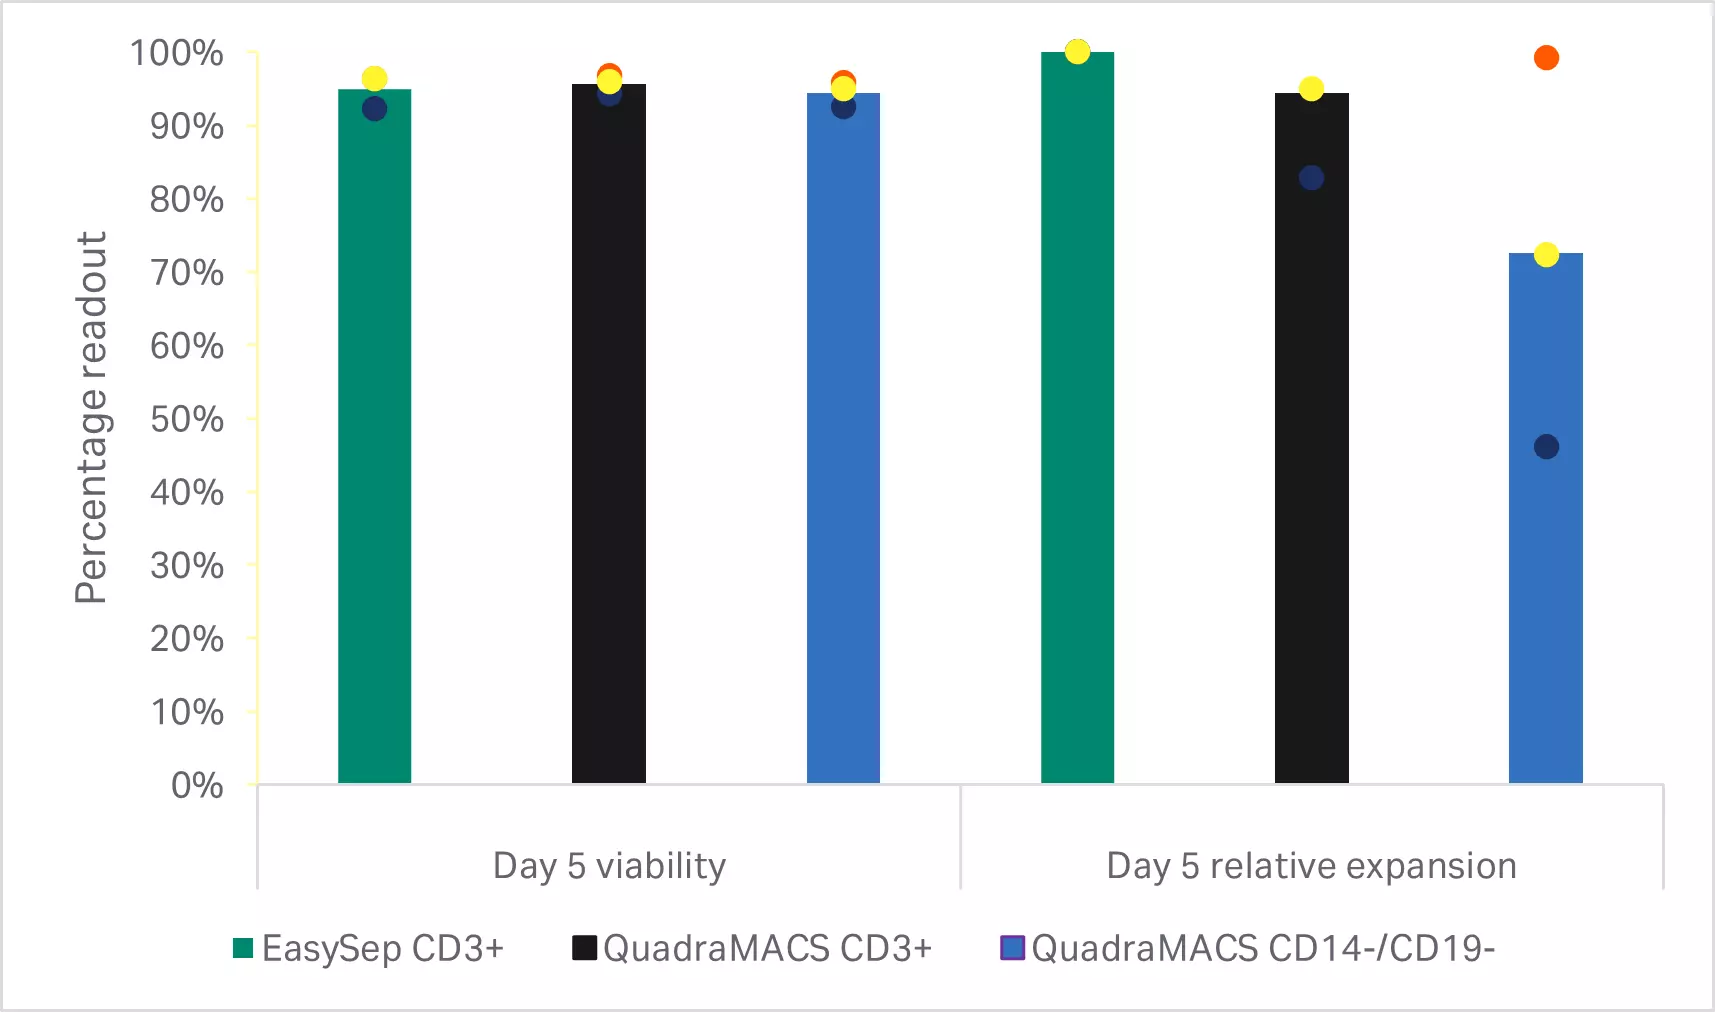
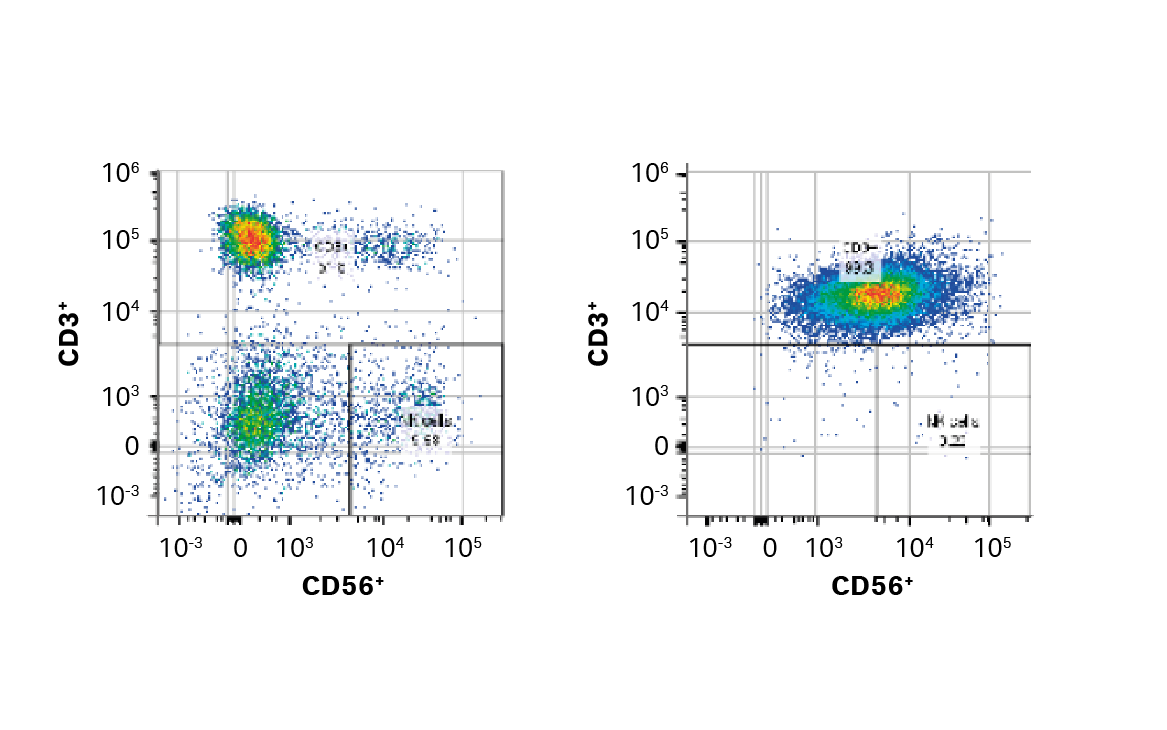
Fig 3. Comparison of enrichment methods. (A) FlowJo™ representation of gated cells before and after EasySep CD3+ selection; (B) recovery, purity, and viability of T cells after either EasySep CD3+ selection, QuadroMACS CD3+ selection, or QuadroMACS CD14+/CD19+ depletion; (C) day 5 viability and cumulative fold expansion relative to the EasySep CD3+ enriched T cell growth of the respective donor. Bars represent the average of the biological triplicates with individual donor values shown by colored dots.
Comparison of T cell transduction methods
In order to optimize transduction, the timepoint to perform transduction after the initial activation of the T cells was evaluated. Earlier timepoints were prioritized to maintain as short a process duration as possible. Several methods for transducing T cells are currently in use. However, a number of these rely on open and manual processing in plates or flasks, which are unlikely to be amenable to GMP requirements.
As an alternative, we tested the automated, functionally closed SpinOculation C-Pro application on the Sepax™ C-Pro instrument to transduce the T cells with lentivirus (LV)-eGFP.
Figure 4 shows results from the determination of optimal day for transduction. T cells enriched through CD3+selection had higher transduction efficiencies than the depletion method when transduced on day 0 (p = 0.000 by one-way ANOVA, n = 3) and day 1 (p < 0.001 by one-way ANOVA, n = 3). However, no differences were seen on cells transduced 2 days after activation (p ≥ 0.05 by one-way ANOVA, n = 3). Overall, the highest transduction efficiency was observed by transducing CD3+ selected cells 1 day after activation (p < 0.02 by one-way ANOVA, n = 3).
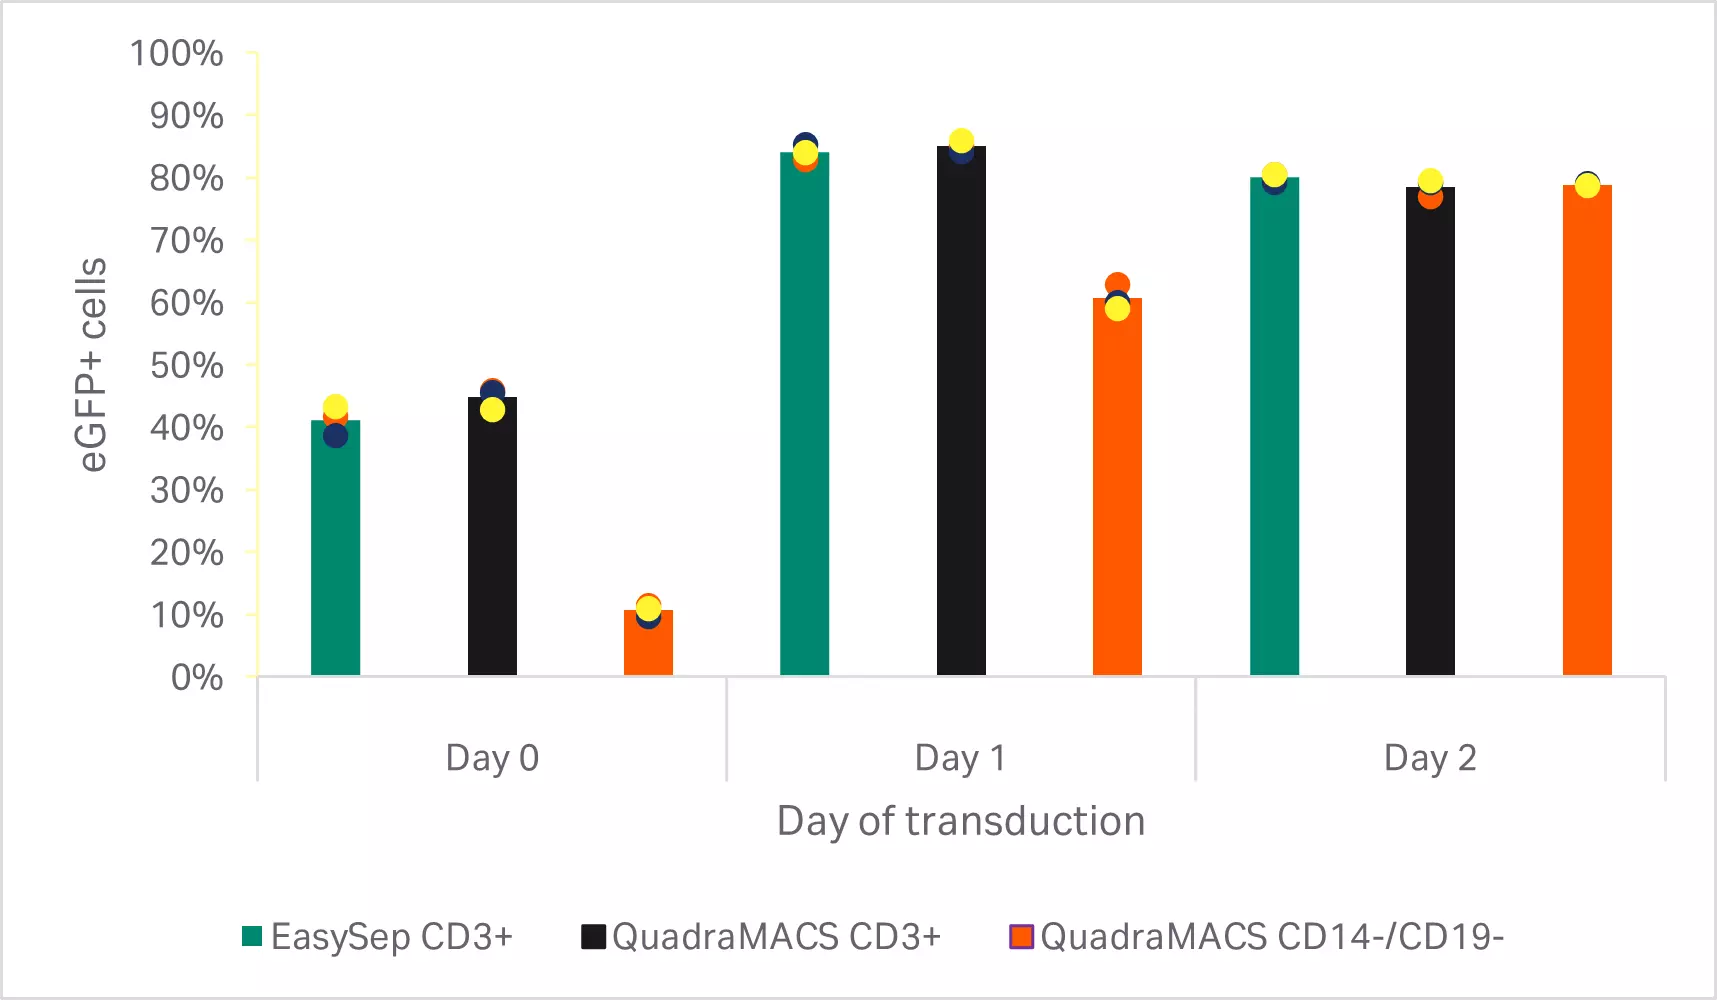
Fig 4. Determination of optimal day for transduction. Percentage of eGFP-positive T cells 72 h after transduction on various days after activation. Bars represent the average of the biological triplicates with individual donor values shown by colored dots.
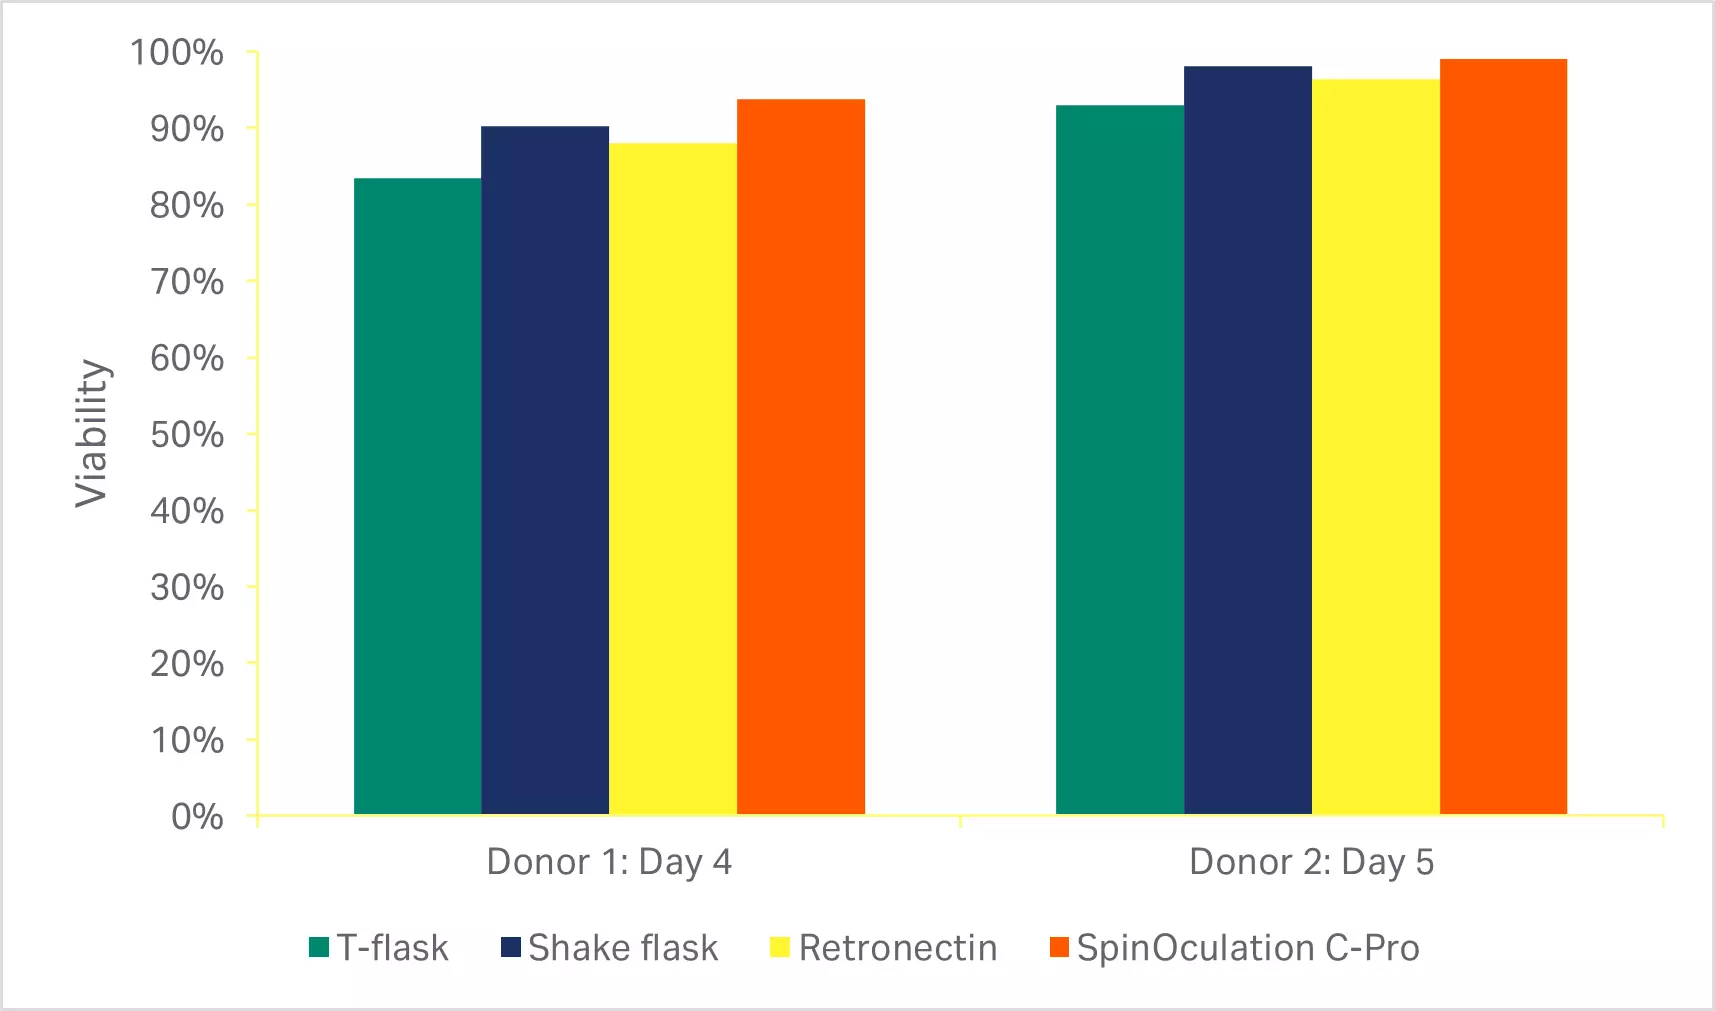
As described in the methods, various manual transduction approaches currently used by numerous groups (T-flasks, shake flasks, and RetroNectin™) were compared to the SpinOculation C-Pro application on the Sepax™ C-Pro instrument. The automated, closed transduction method with SpinOculation C-Pro on the Sepax™ C-Pro resulted in both comparable viability (Fig 5A) and transduction efficiency at the end of culture (Fig 5B).
(A)
(B)
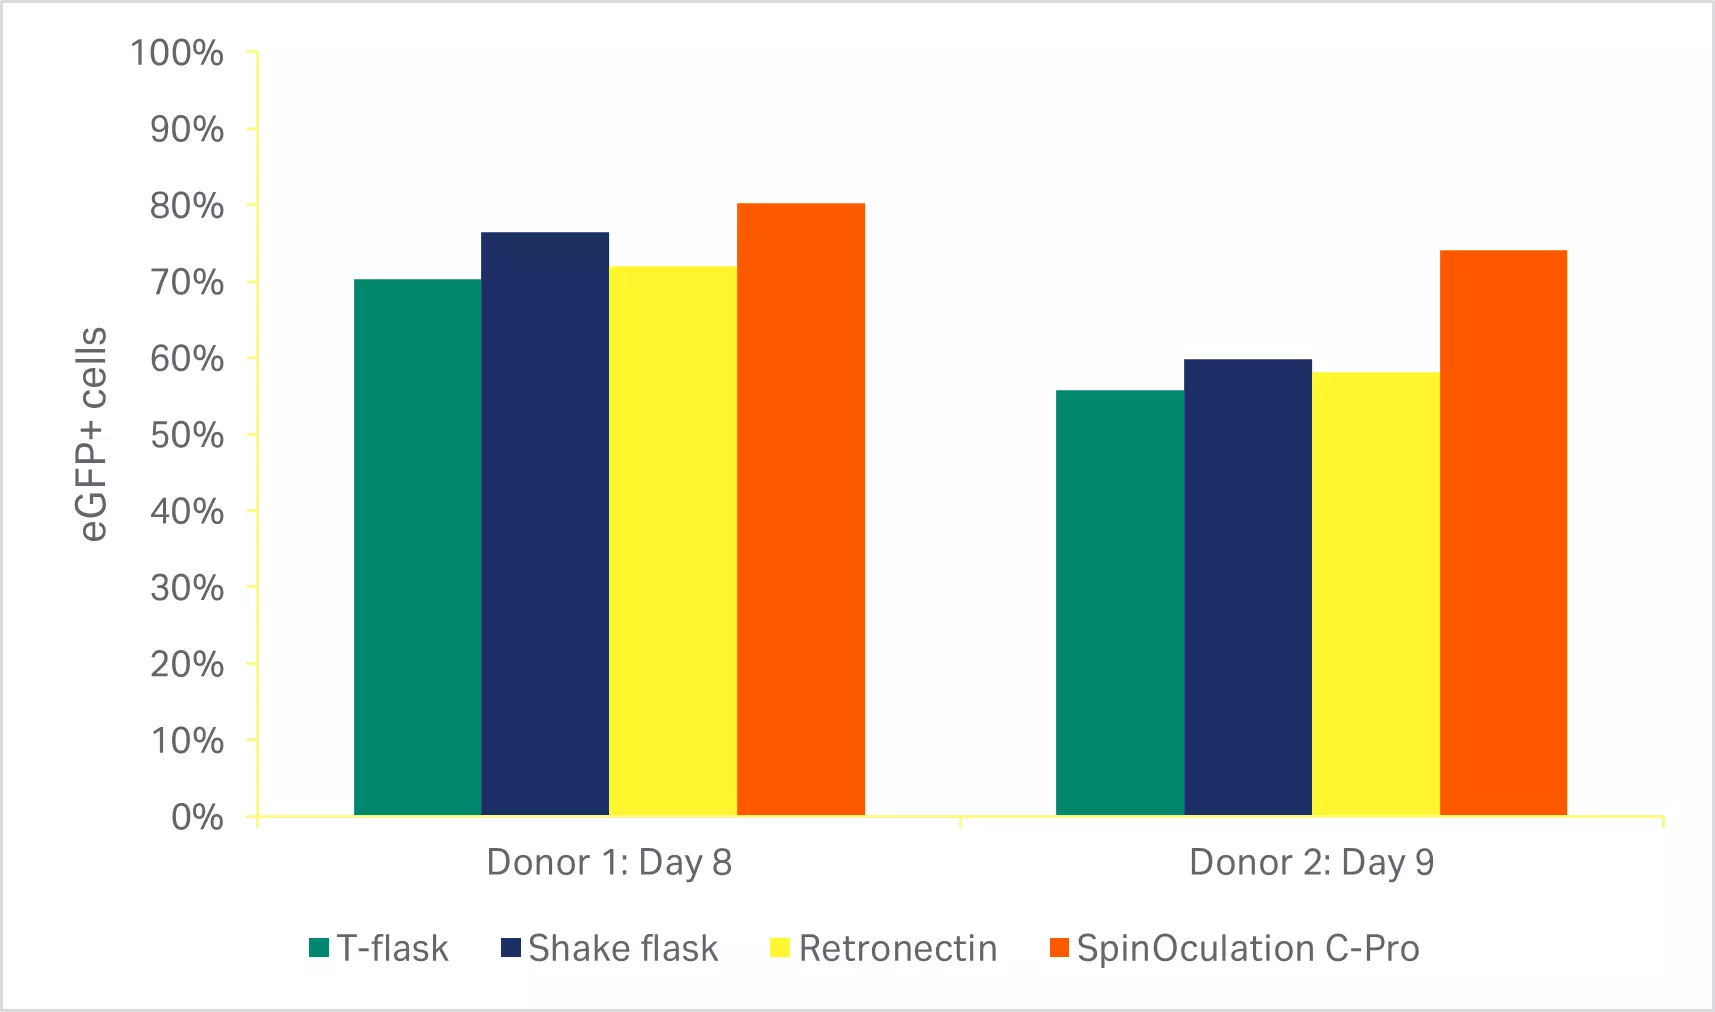
Fig 5. Comparison of transduction methods. (A) Viability of cells using various transduction methods after activation phase of culture (3 days or 4 days after transduction); (B) percentage of eGFP-positive T cells at the end of culture (7 or 8 days after transduction). Bars represent the average of technical triplicates that were run for each of two biological donors.
Comparison of T cell expansion methods
There are several open methods for culturing T cells at small scale prior to entering a bioreactor, with culture in T-flasks being the more common method. There are also closed methods such as gas permeable bags and G-Rex™, but in our previous evaluations, these were not able to reach the same growth kinetics observed in T-flasks (data not published). We investigated Erlenmeyer shake flasks as a closed culturing alternative that could match the fold expansion of T cells inoculated in T-flasks.
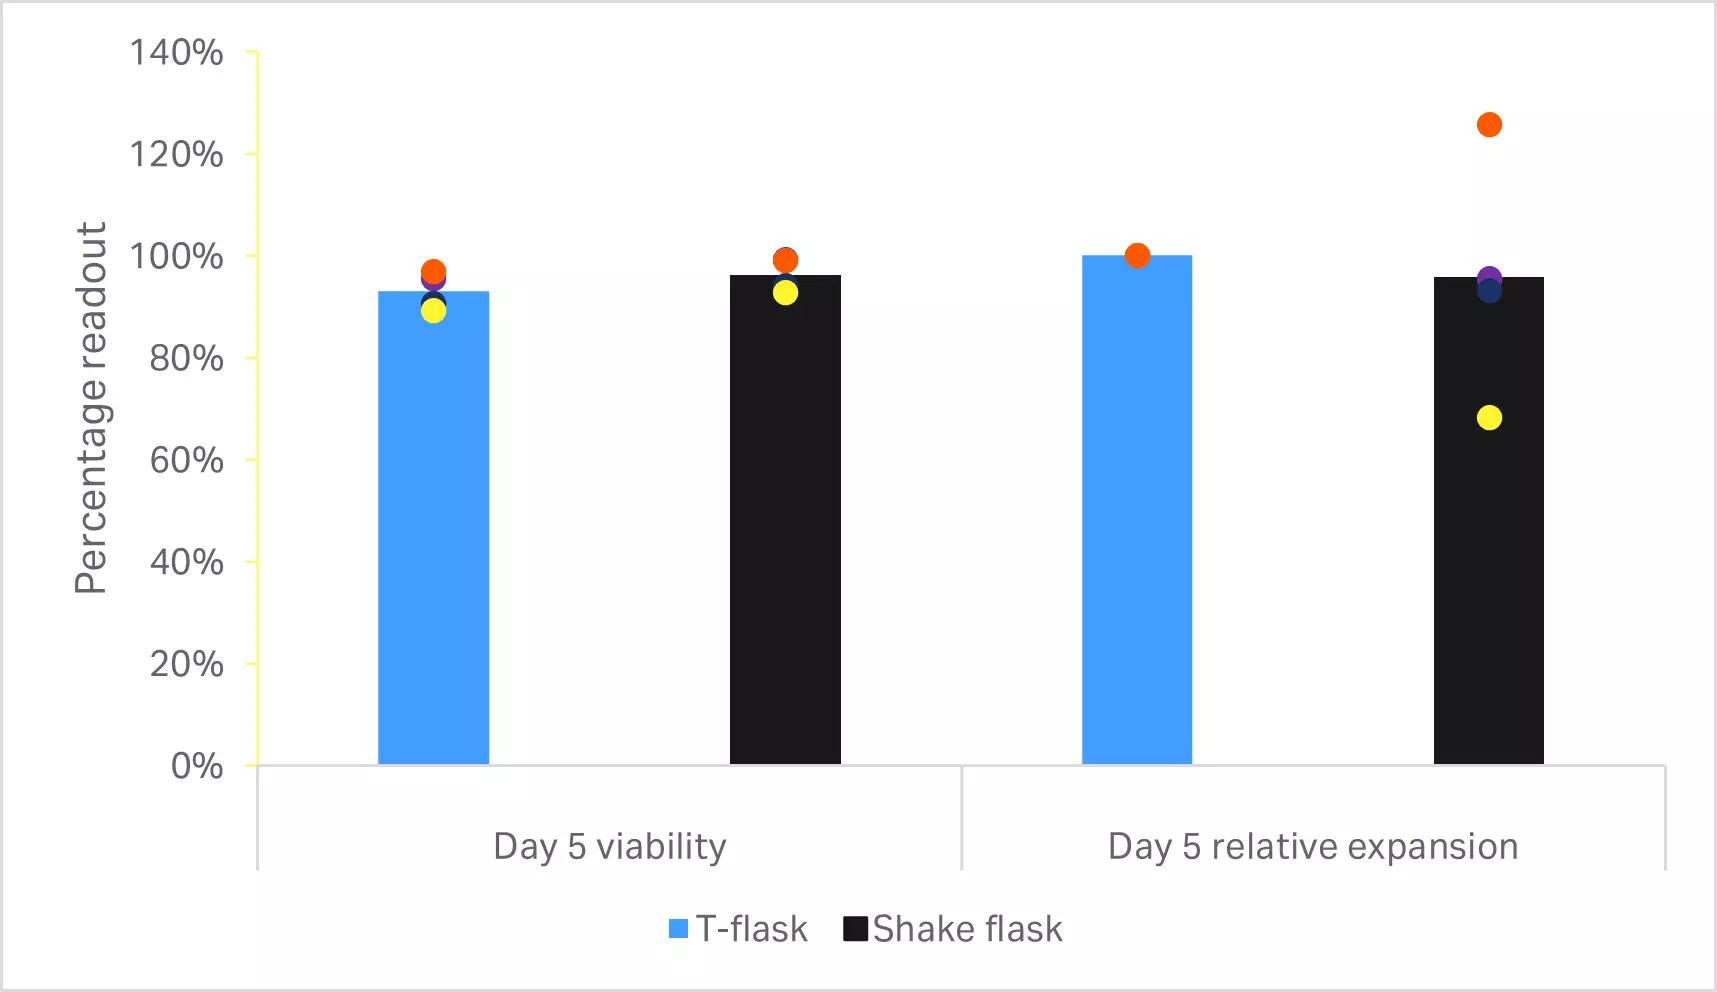
No statistically significant differences were found in the T cell viability or expansion (p ≥ 0.05 by 2-sample t-test, n = 4) (Fig 6A). Phenotypic comparison of cells at the end of culture are shown in Figure 6B. No statistically significant differences were found in T cell purity or CD4+ and CD8+ subpopulations (p ≥ 0.05 by 2-sample t-test, n = 4).
(A)
(B)
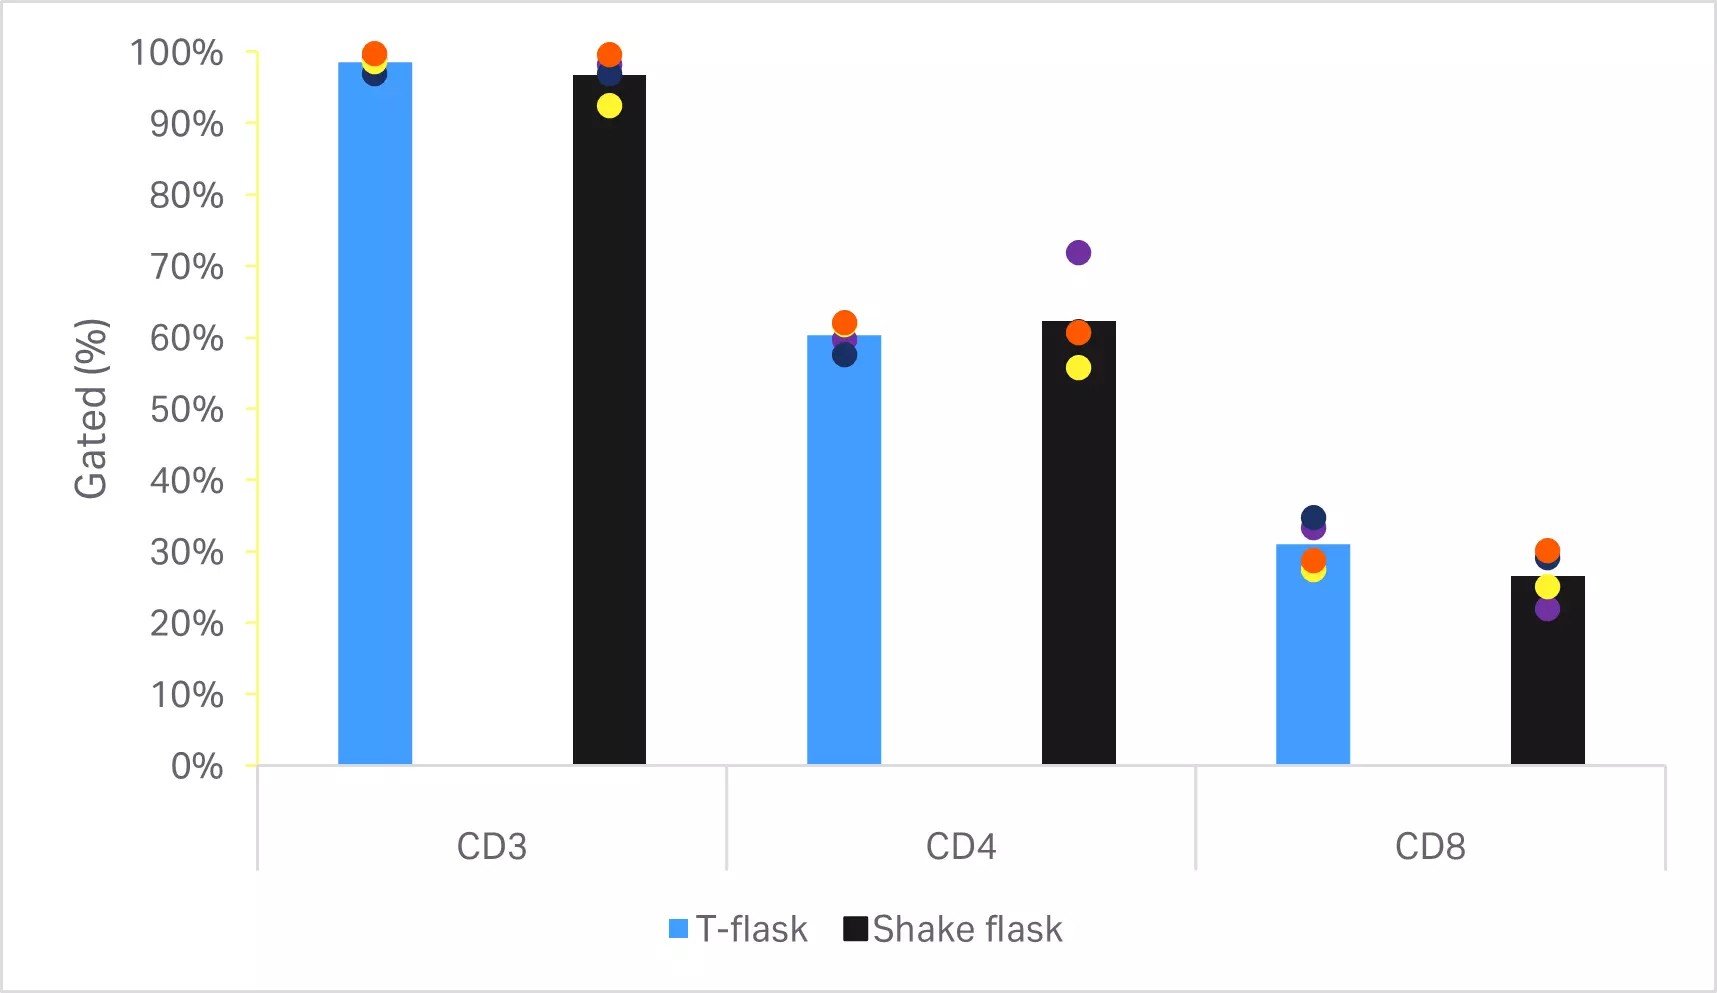
Fig 6. Comparison of small-scale culturing methods. (A) Day 5 viability and cumulative fold expansion relative to the T cell growth in T-flask of the respective donor; (B) phenotypic analysis of T cells and subpopulations CD4+ and CD8+ cells by flow cytometry at the end of culture. Bars represent the average of four biological replicates with individual values shown by colored dots.
Large-scale transduced T cell production
The automated thawing and washing of leukopaks were implemented along with T cell enrichment using the EasySep Release Human CD3 Positive Selection Kit, SpinOculation C-Pro application on the Sepax™ C-Pro instrument, and small-scale activation and expansion in shake flasks and Xuri™ Cell Expansion System W25 (Fig 7).
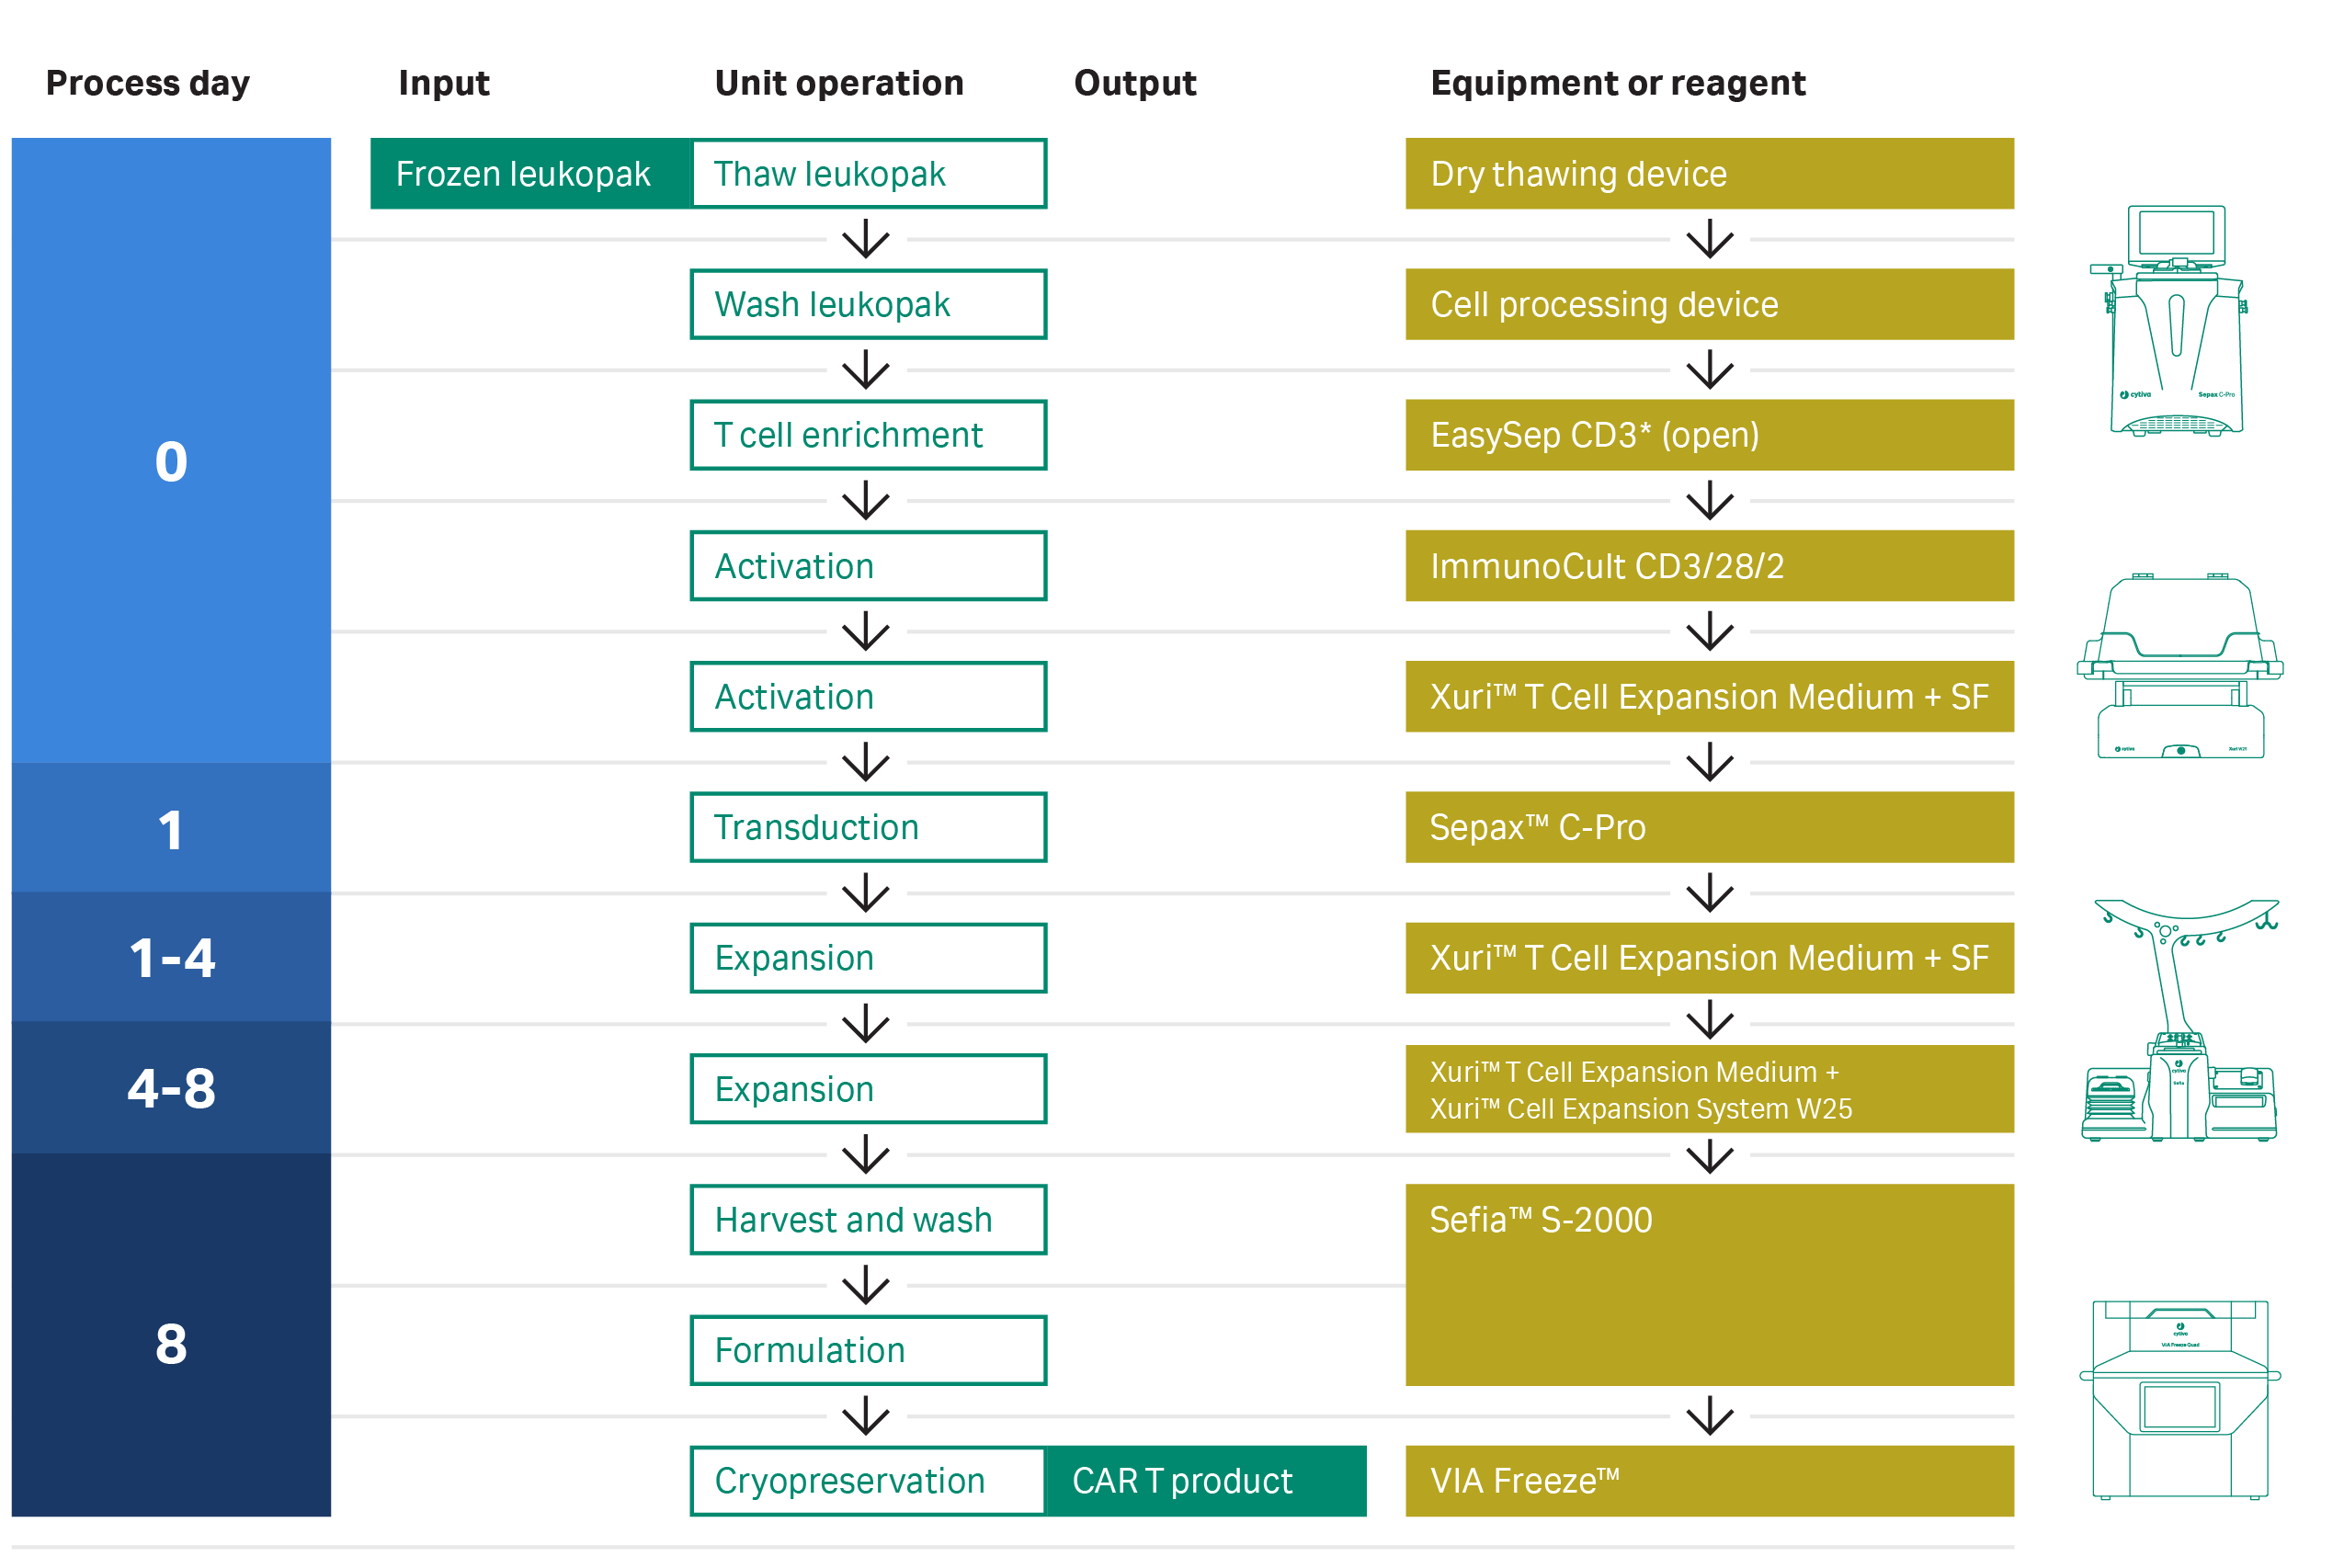
Fig 7. Process workflow. A diagram of the steps and systems used to prepare a clinically relevant dose of CAR T cells from frozen leukapheresis units. Most steps were functionally closed and automated, and process is compatible with GMP guidelines. SF = shake flask.
From three large-scale production runs, we were able to get over 75% cell recovery from the thaw and wash steps using the setup described, with greater than 90% viability (Fig 8A). Populations of enriched T cells were obtained by magnetic separation using the EasySep system, which increased T cell purity starting from 53% to 62% in the initial input population to above 95% in the output, regardless of different starting populations of cells (Fig 8B).
(A)
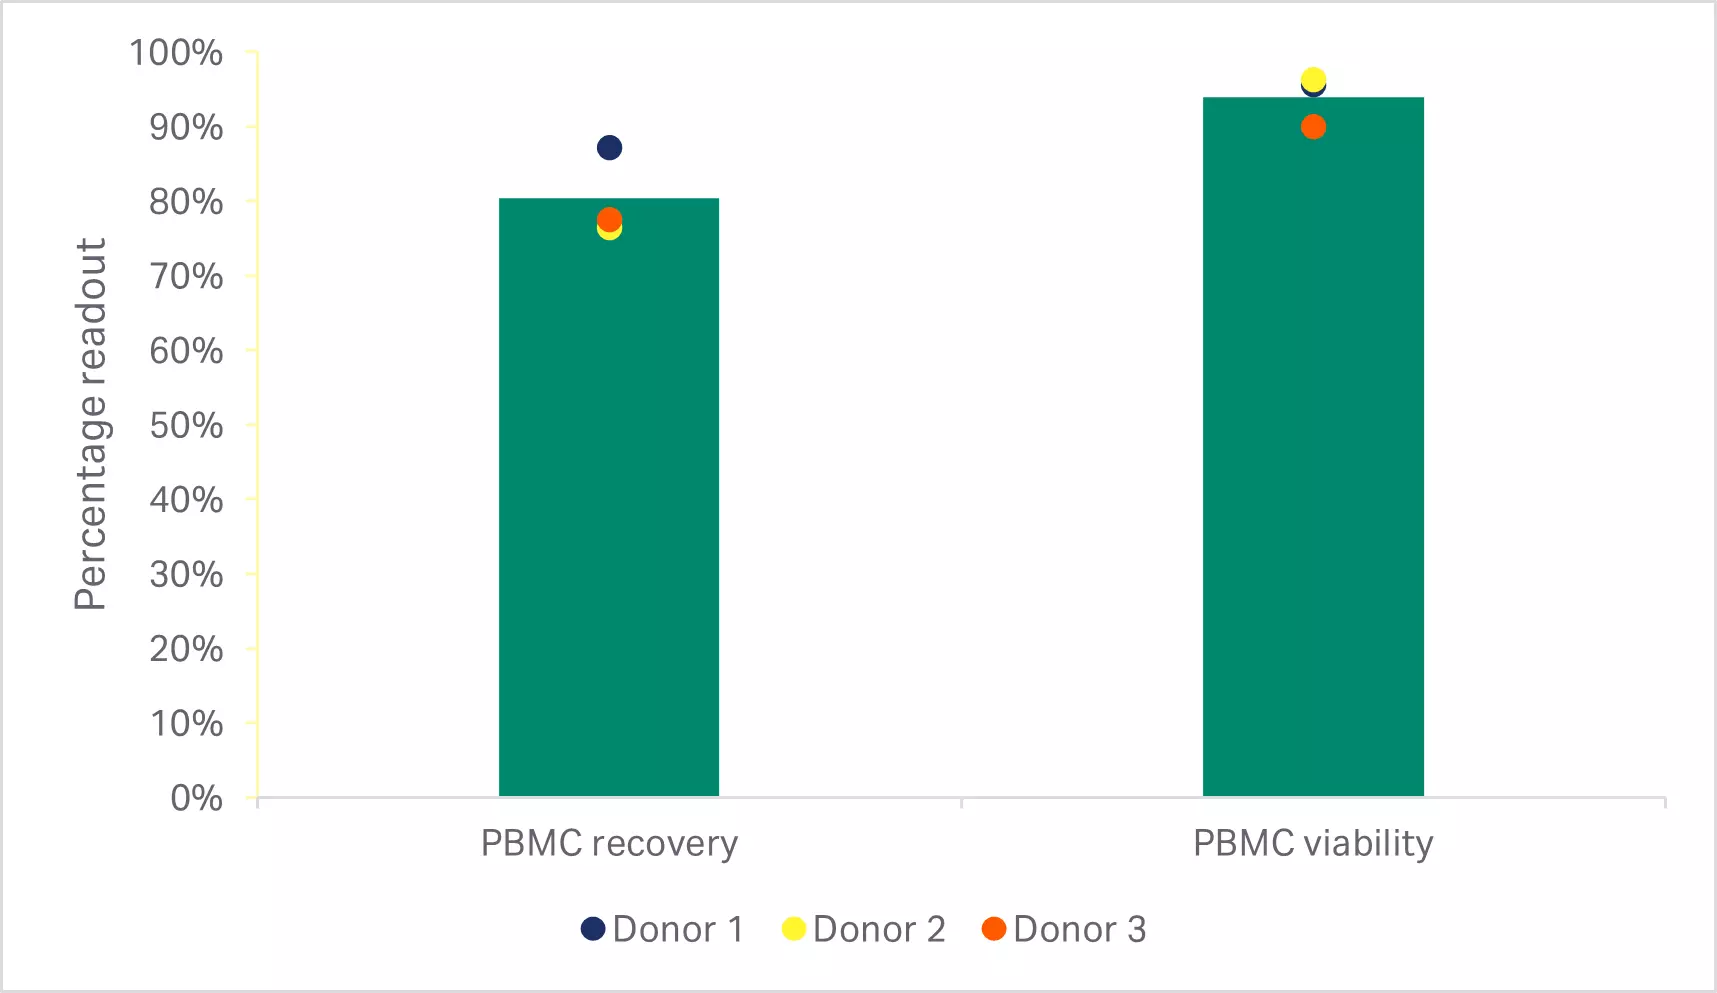
(B)
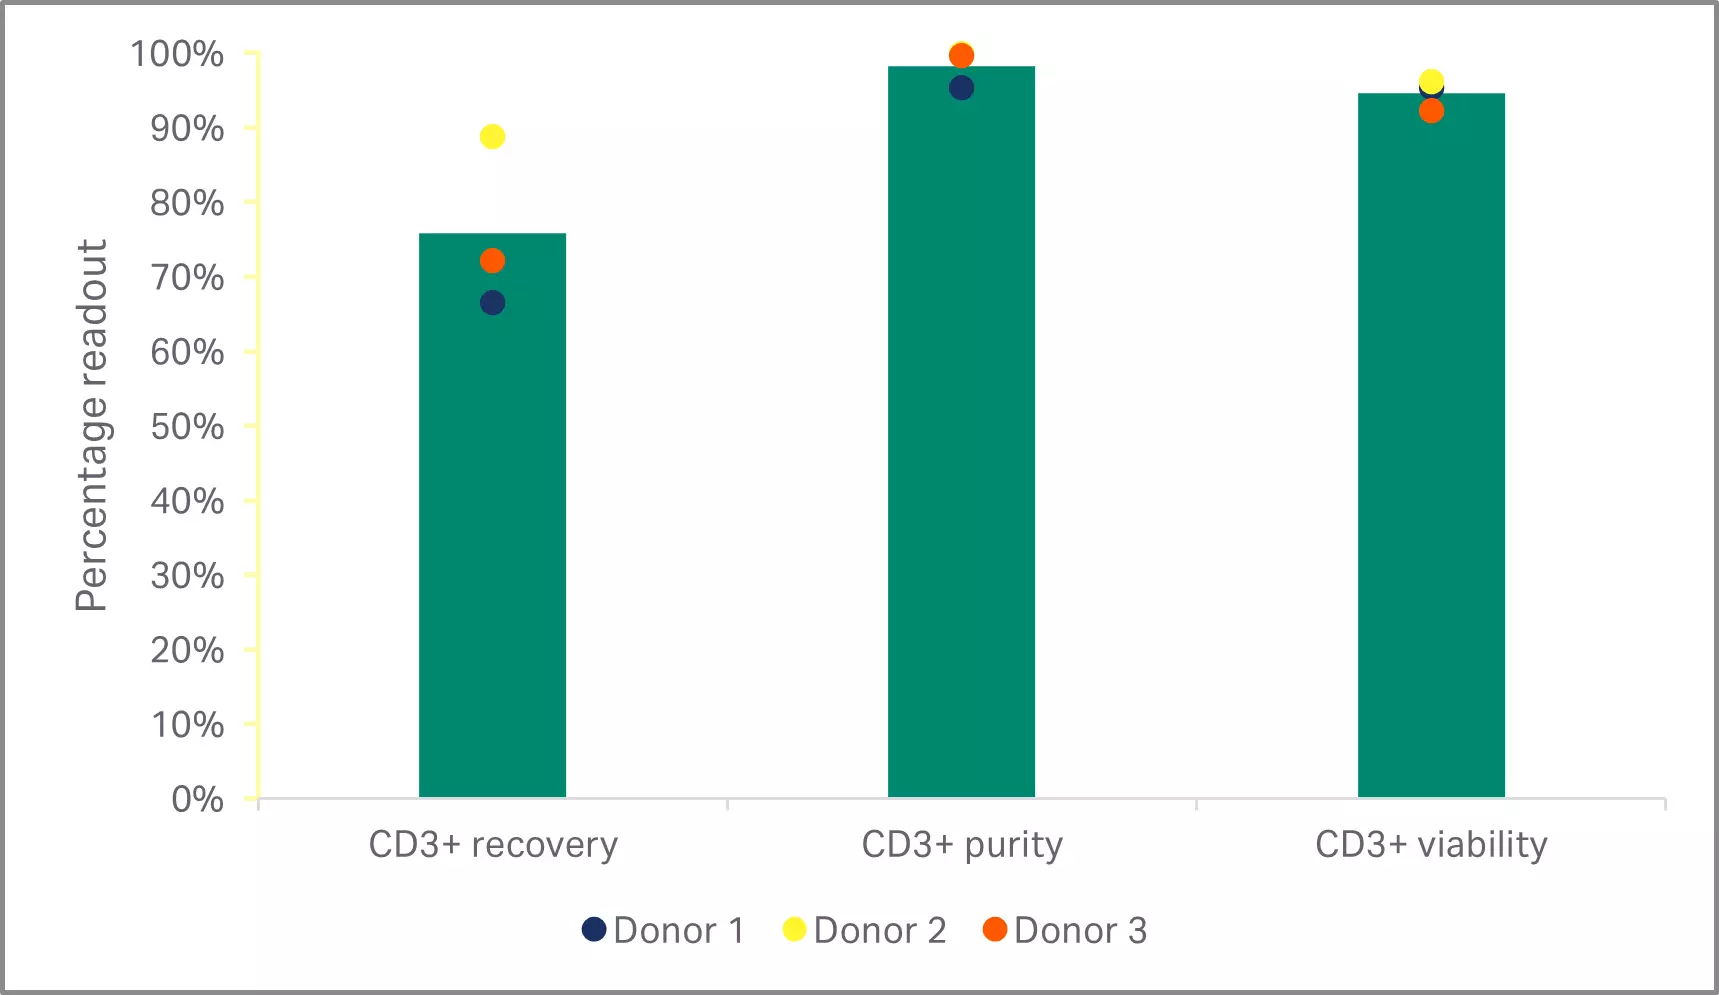
Fig 8. Purity and recovery of T cells after enrichment. (A) Viable PBMC recovery and viability after washing step; (B) Recovery, purity, and viability of enriched T cells after EasySep Release Human CD3 Positive Selection. Bars represent the average of the biological triplicates with individual donor values shown by colored dots.
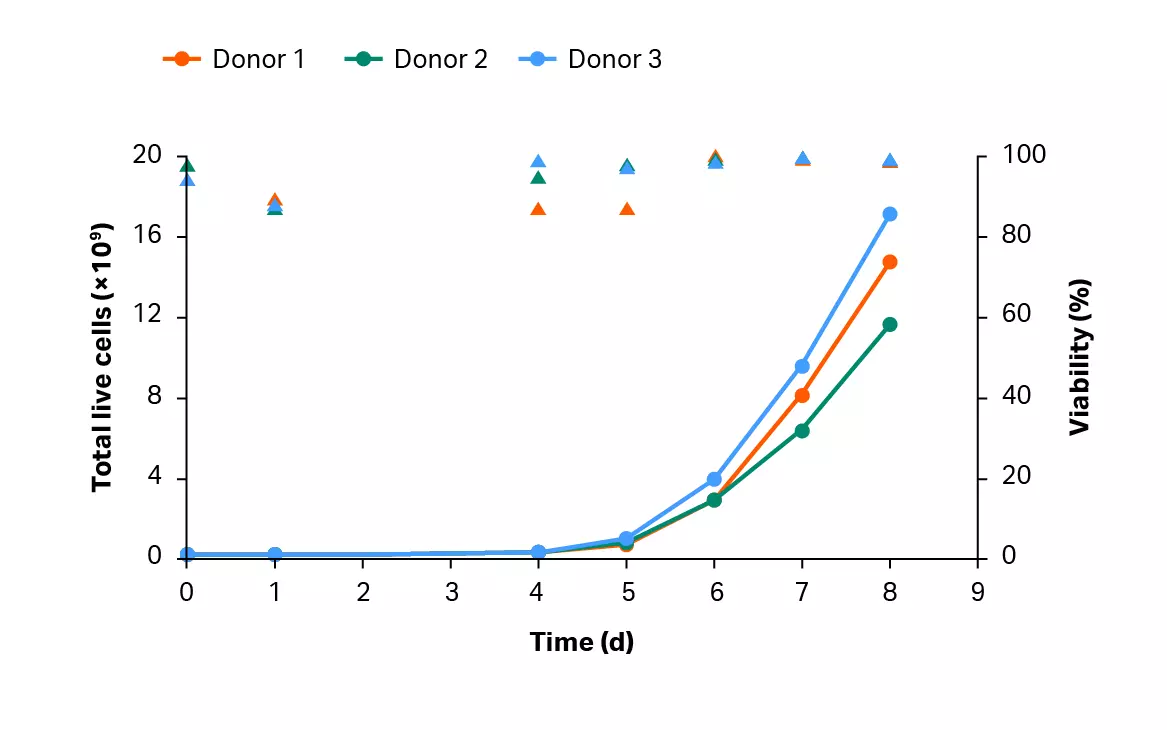
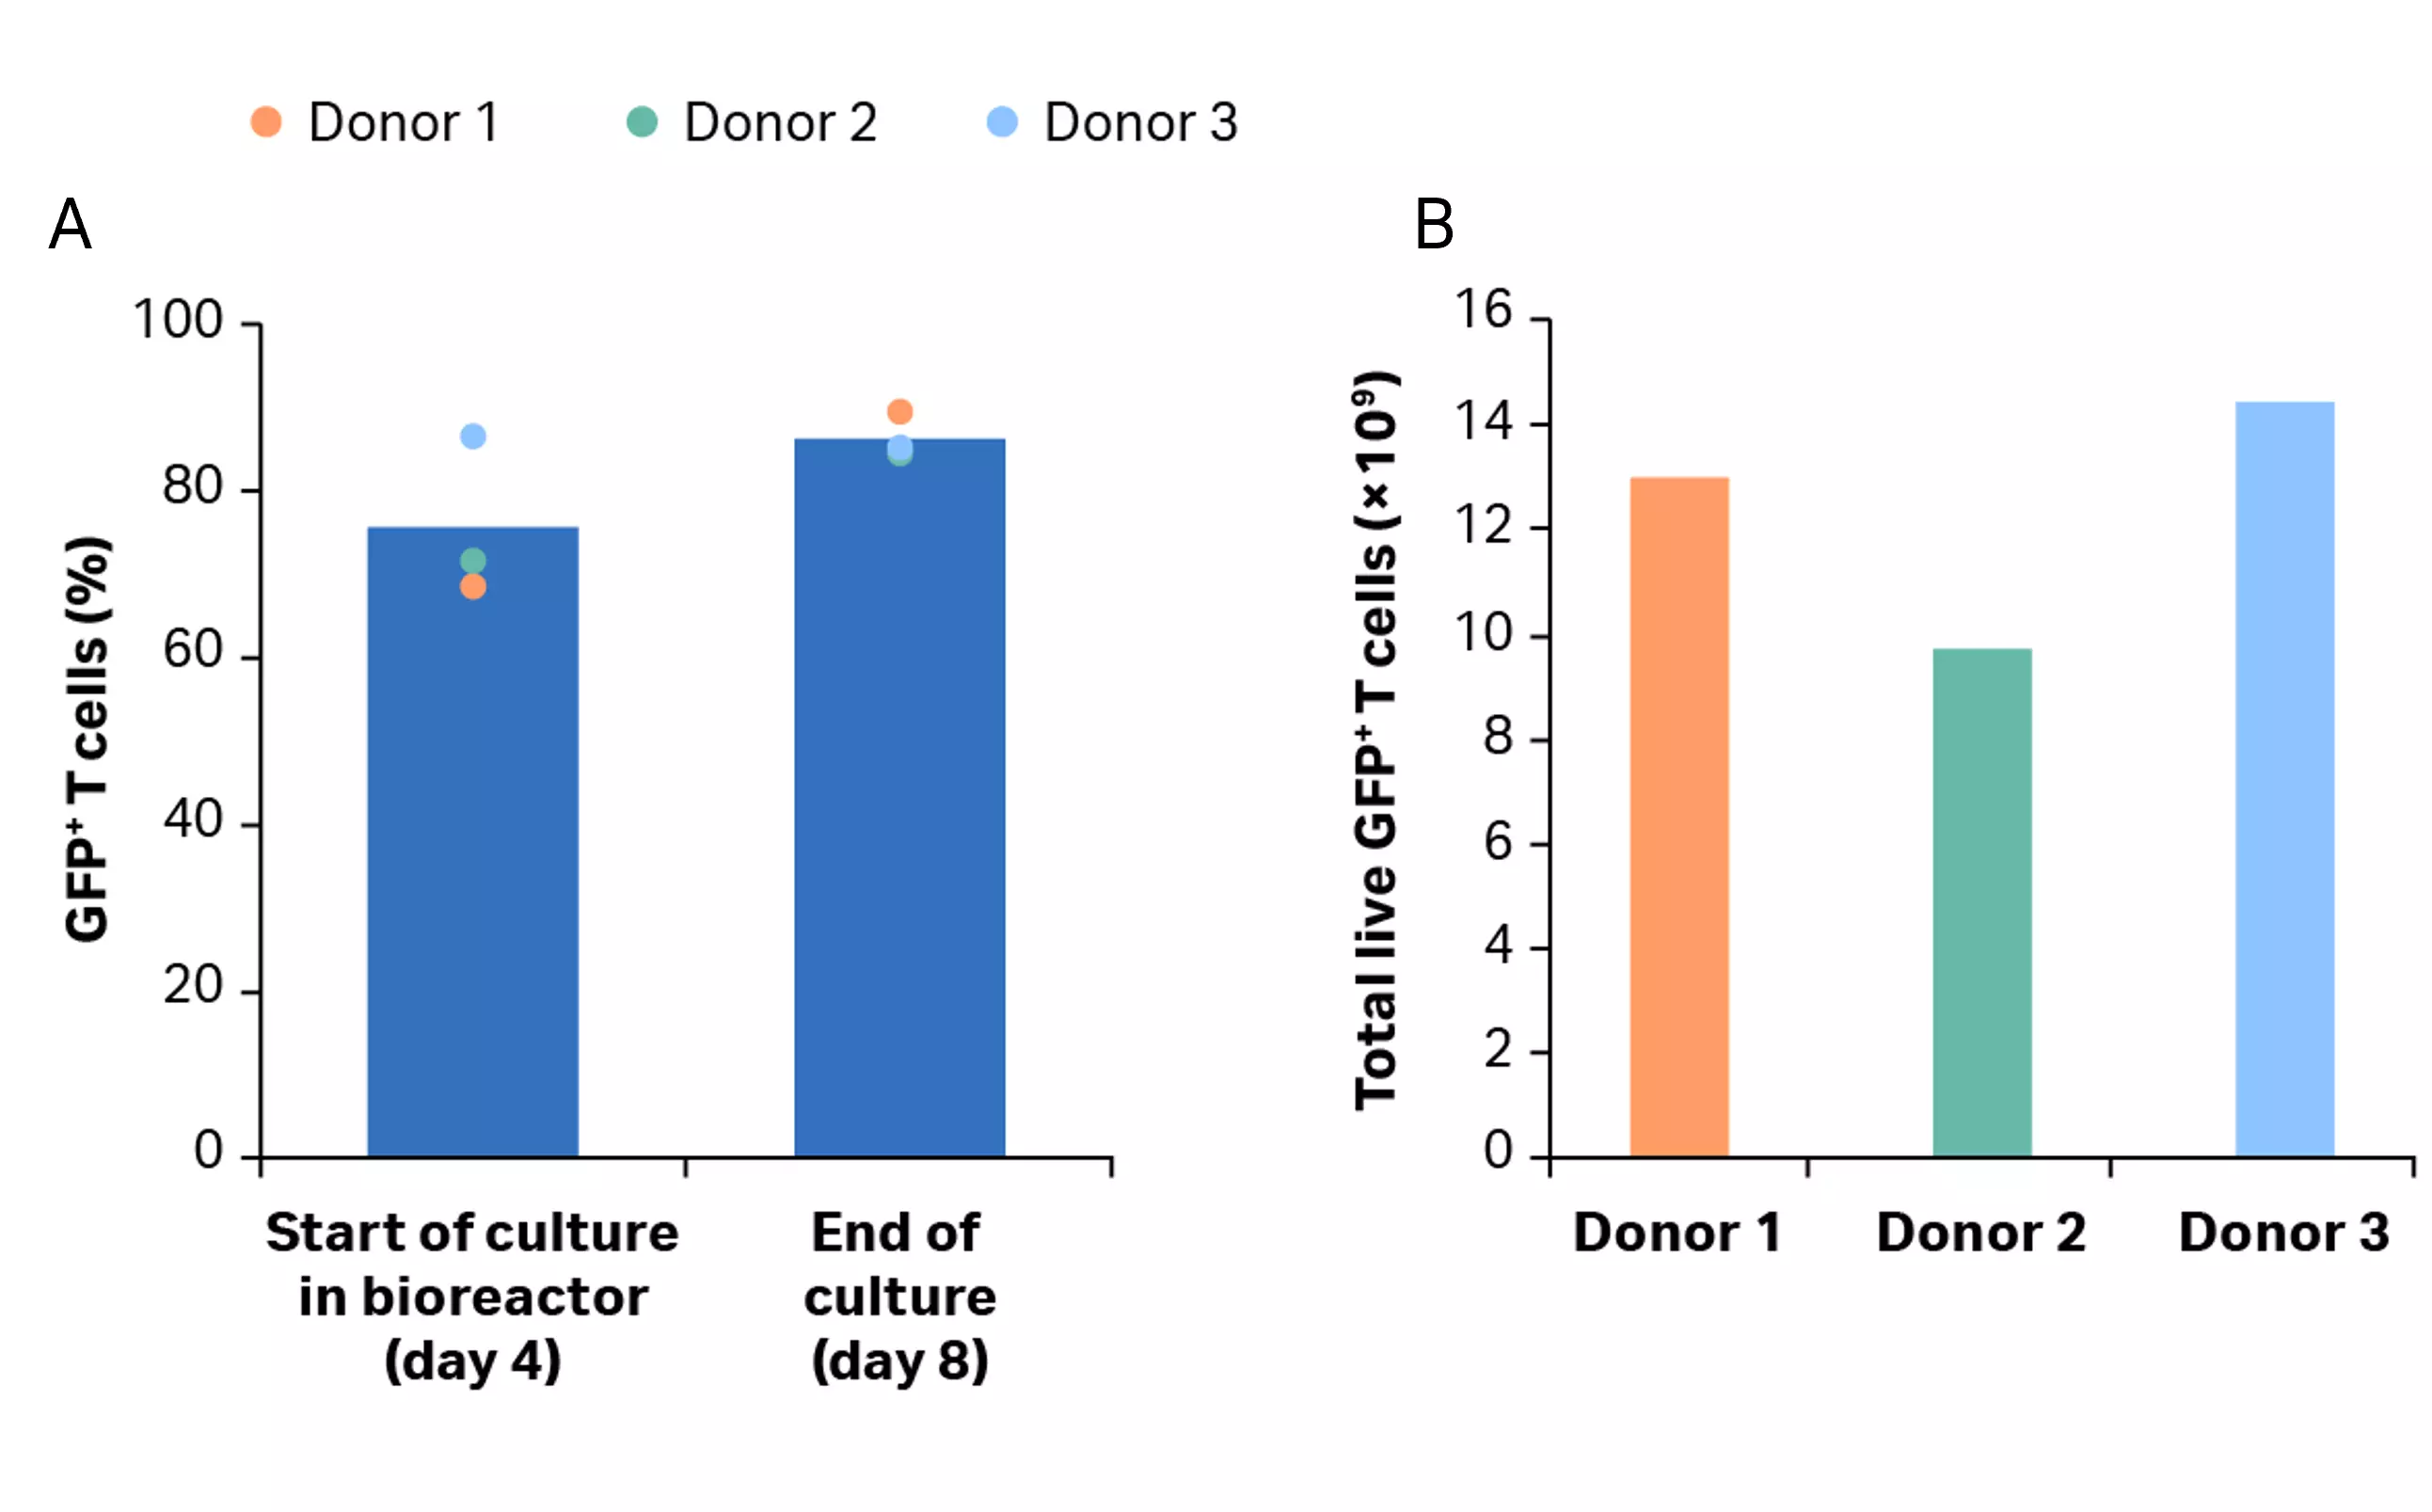
After isolation, cells were activated, transduced and expanded in shake flasks for 4 days before being transferred into the Xuri™ Cell Expansion System W25. After 4 days, over 68% of the T cell population was transduced (Fig 9A). T cells were expanded in the Xuri™ Cell Expansion System W25 by over 78-fold from the starting cell population (Fig 9B). Transduction was maintained above 84% throughout the culture (Fig 9B) resulting in over 1 × 10¹⁰ transduced T cells on day 8, on average (Fig 9C).
(A)
(B)
(C)
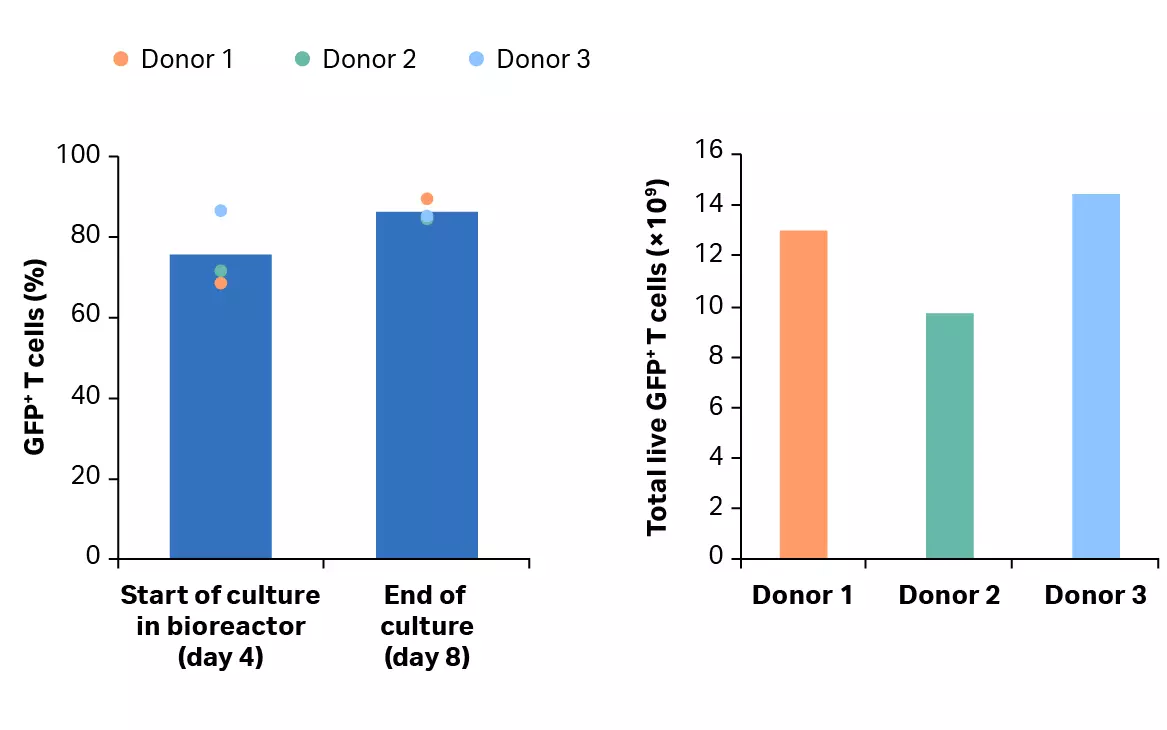
Fig 9. Culture growth and transduction efficiency. (A) Cumulative growth and viability of T cells. Lines represent the expansion profile and triangles represent the viability during the CAR T process; (B) percentage of transduced GFP+ T cells after activation in shake flasks and after culture in the Xuri™ Cell Expansion System W25. Bars represent the average of the biological triplicates with individual donor values shown by colored dots; (C) cumulative GFP+ T cells on day 8 for donors 1, 2, and 3.
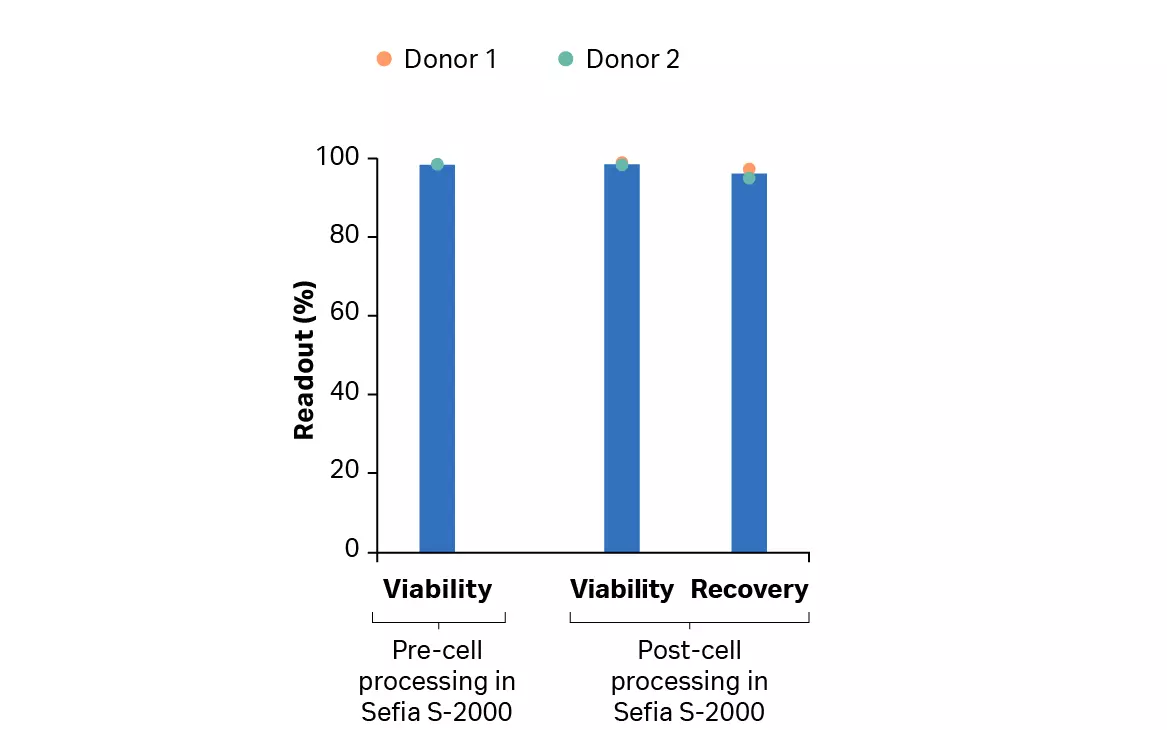
After culture, expanded transduced T cells were harvested using the FlexCell application on the Sefia™ cell processing instrument prior to cryopreservation. After volume reduction, wash, and cryoformulation, total live cell recovery was over 95% without a decrease in viability (Fig 10A). Cryogenic bags of cells were cryopreserved using the VIA Freeze™ Quad controlled ate freezer before being transferred to liquid nitrogen storage.
Figure 10B shows the viability and recovery post-thaw using VIA Thaw™ instrument after manual washing, centrifugation, and buffer exchange to evaluate the cells after cryopreservation (as a surrogate to the product ultimately infused into the patient). As shown, over 70% of the cells were recovered with above 97% viability. The results also show that transduction was maintained above 80% through the cryopreservation process.
(A)
(B)
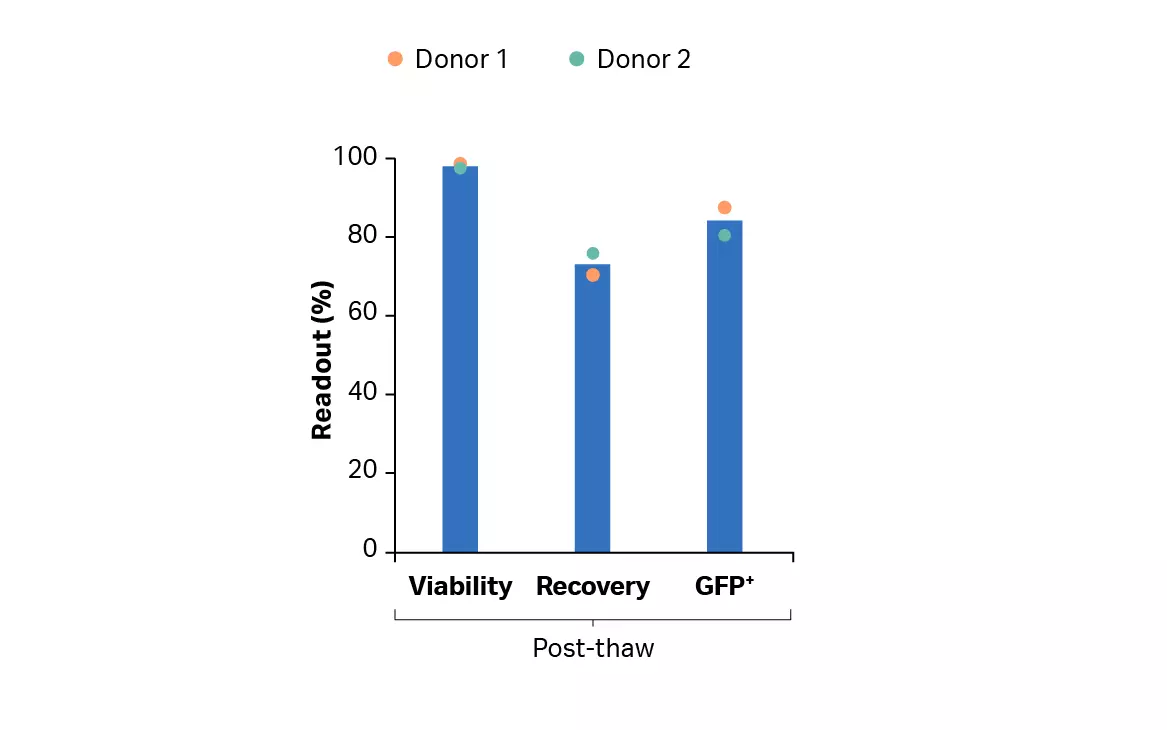
Fig 10. Recovery and viability of T cells. (A) Recovery and viability of cultured T cells, from donor 1 and 2 after harvest using FlexCell application on the Sefia instrument; (B) post-thaw recovery and viability of transduced T cells cryopreserved after cryoformulation using FlexCell application on Sefia instrument.
Conclusions
The workflow used in this study is suitable for industrialized, autologous CAR T cell production, because it incorporates several automated and functionally closed unit operations. This large-scale transduced T cell production provided clinically relevant doses (1 × 10¹⁰ cells per donor) with high transduction efficiency (> 80% eGFP+). Phenotypically, the final product demonstrated characteristics of an activated T cell population.
Future work could focus on fine-tuning each step to reduce costs while maintaining a robust, scalable process. For example, bioprocess parameters such as agitation and rocking speed, as well as perfusion strategy, could be further improved by reducing the amount of media exchange and optimizing rocking speed and angle.
Overall, the methodology presented here is compatible with industrial workflows for CAR T manufacturing. This article shows the feasibility of a semi-automated T cell expansion and closure of key unit operations. In particular, the small-scale expansion in shake flasks demonstrates the possibility of an alternative to conventional static culture in gas-permeable bags or closed flasks.
Acknowledgements
All work was performed in collaboration with CCRM through funding from FedDev Ontario and Cytiva at the Centre for Advanced Therapeutic Cell Technologies (CATCT), Toronto, Ontario, Canada. The reporting and interpretation of the research findings are the responsibility of the author(s).
References
- American Cancer Society. Cancer Facts & Figures 2023| American Cancer Society. www.cancer.org. Published 2023. https://www.cancer.org/research/cancer-facts-statistics/all-cancer-facts-figures/2023-cancer-facts-figures.html.
- Approved Cellular and Gene Therapy Products, United States Food and Drug Administration. Accessed 22 May 2019.
Learn how we can help you secure and standardize your manufacturing process with closed, automated systems.
Ordering information
| Product | Product code |
|---|---|
| Sepax C-Pro Cell Processing Instrument | 29264741 |
| Sepax C-Pro applications software pack | 29734656 |
| CT-60.1 Sepax C-Pro Cell Processing Kit | 29264739 |
| Sefia S-2000 Cell Processing Instrument | 29285527 |
| FlexCell Sefia Protocol Software | 16301 |
| CT-800.1 Sefia Cell Processing Kit | 20001 |
| Dulbecco's Phosphate Buffered Saline (DPBS) | SH30028.03 |
| Xuri T Cell Expansion Medium 1000 mL | 29185231 |
| Xuri IL-2 (1 mg) | 29062790 |
| Xuri Cell Expansion System W25 | 29064568 |
| Xuri Cell Expansion System Cellbag Perfusion, pH and DO, 2 L | 29105498 |
| VIA Freeze Quad | VFQ_30010 |
| 50 mL bag SBS plate for VIA Freeze freezers | ASY_30038 |
| VIA Thaw L1000 | 29403109 |
Comparison of thawing and washing methods
Cells from three donor leukopaks (HemaCare) were either thawed directly in a 37°C water bath followed by manual cell washes, or thawed and processed in an automated manner. The Sepax™ C-Pro instrument is recommended as the equivalent instrument for cell processing for manufacturing purposes.
In both cases, T cells were subsequently enriched using the EasySep Release Human CD3 Positive Selection Kit (STEMCELL Technologies) according to the manufacturer’s protocol.
Comparison of T cell enrichment and activation methods
Leukopaks from three donors were processed in an automated manner.
T cells were then enriched using either EasySep Release Human CD3 Positive Selection Kit, CD3 Microbeads run through an LS Column using the QuadroMACS Separator (Miltenyi Biotec), or a combination of CD14 and CD19 Microbeads run through an LD Column using the QuadroMACS Separator. The fractions containing the enriched T cells were activated by ImmunoCult™ Human CD3/CD28/CD2 T cell Activators (STEMCELL Technologies). All other listed materials are from Miltenyi Biotec.
All subsequent T cell expansion was done using cell culture medium prepared by supplementing Xuri™ T Cell Expansion Medium with 5% heat-inactivated human AB serum (Gemini) and 350 IU/mL Xuri™ IL-2 growth factor. Cells were inoculated into Nunc™ tissue culture-treated multiwell plates (Thermo Fisher Scientific) at a density of 1 × 10⁶ cells/mL, counted every day after day 3, and diluted to 5 × 10⁵ cells/mL.
Comparison of T cell transduction methods
Impact of selection method and timing of lentivirus (LV) addition
A subset of the activated T cells from the various enrichment methods mentioned previously were transduced either the same day as activation, or 1 or 2 days after activation to gauge the impact of enrichment method and time prior to viral addition on transduction efficiency.
T cells were transduced with LV-eGFP vector (Tailored Genes) at a multiplicity of infection (MOI) of 2.5 in Nunc tissue culture-treated multiwell plates. Volumes were doubled with fresh media to improve cell health 16 to 20 h after transduction. Transduction efficiency was measured on the CytoFLEX™ Flow Cytometer (Beckman Coulter) 48 h after media addition.
Impact of transduction method
To compare several methods of transducing T cells, leukopaks from two donors were processed in an automated manner.
T cells were then enriched using EasySep Release Human CD3 Positive Selection Kit and activated using the ImmunoCult Human CD3/CD28/CD2 T cell Activators. Cells were inoculated into Nunc tissue culture-treated T-flasks (Thermo Fisher Scientific) at a density of 1 × 10⁶ cells/mL and cultured in an incubator (37°C, 5% CO2) for 1 day to allow them to activate before transduction.
Activated T cells were transduced with LV-eGFP at a MOI of 2.5 by inoculating the virus and cells in either Nunc T-flasks, shake flasks (Corning), or RetroNectin-coated plates (Takara). A subset of activated T cells were transduced in a closed automated manner using the SpinOculation C-Pro application on the Sepax™ C-Pro instrument at the same MOI. The cells in T-flasks and RetroNectin-coated plates were cultured in an incubator (37°C, 5% CO2). The cells transduced with LV-eGFP using the SpinOculation C-Pro application were inoculated into Erlenmeyer shake flasks, and both sets of shake flasks were cultured on a MaxQ™ CO2 Plus Shaker (Thermo Fisher Scientific) in an incubator (37°C, 5% CO2, 90 rpm).
Volumes were doubled with fresh media to improve cell health 16 to 20 h after transduction. Cells were cultured for an additional 2 or 3 days to allow them to activate before further manipulations were performed. After a total of 4 or 5 days of culture, cells were counted and diluted to 5 × 10⁵ cells/mL every day for an additional 4 days. At the end of culture, transduction efficiency was measured on the CytoFLEX Flow Cytometer.
Comparison of T expansion methods
Leukopaks from four donors were processed in an automated manner.
T cells were then enriched using EasySep Release Human CD3 Positive Selection Kit and activated by ImmunoCult Human CD3/CD28/CD2 T cell Activators. Cells were inoculated into Nunc tissue culture-treated T-flasks or Erlenmeyer shake flasks and seeded at a density of 1 × 10⁶ cells/mL. Shake flasks were placed on a MaxQ CO2 Plus Shaker at 90 rpm while the T-flasks remained static. Cells were cultured in an incubator (37°C, 5% CO2) for 3 days to activate before manipulations were performed. After 3 days, cells were counted and diluted to 5 × 10⁵ cells/mL. Cells were maintained for 5 days, and then phenotypic analysis was performed on the CytoFLEX Flow Cytometer.
Large-scale transduced T cell production
Thaw and wash
A frozen leukopak was thawed in an automated manner, then connected via a spike port to a functionally closed system for thawing cellular products. CT-60.1 kit on Sepax™ C-Pro instrument with CultureWash C-Pro application is the recommended equivalent system for cell therapy processes (Table 1).
Cells were diluted with HyClone Dulbecco’s phosphate-buffered saline without calcium or magnesium (DPBS-/-) supplemented with 2% heat-inactivated human serum AB and 1 mM EDTA (Sigma). A wash was performed, and cells were extracted in the starting volume of wash buffer.
Table 1. Equivalent CultureWash C-Pro parameters1
| Parameter | Proprietary cell processing system | CultureWash C-Pro on Sepax™ C-Pro |
|---|---|---|
| Input volume | 50–880 mL (70 mL) | 20–1200 mL (70 mL) |
| Detect initial volume | N/A (No) | Flag (No) |
| Input bag rinsing | N/A (Yes) | Flag (Yes) |
| Input bag rinse volume | N/A (50 mL) | 25–100 mL (50 mL) |
| Pause input bag rinsing | N/A (No) | Flag (No) |
| Final volume | 50–200 mL (70 mL) | 8–500 mL (70 mL) |
| Dilution ratio | 0.0–2.0 (2.0) | 0.0–3.0 (2.0) |
| Intermediate volume | N/A (10 mL) | 5–50 mL (10 mL) |
| Optical cells detection | N/A (Yes) | Flag (Yes) |
| Dilution speed | N/A (17 mL/min) | 10–120 mL/min (17 mL/min) |
| g-force | N/A (400 × g) | 100–800 × g (400 × g) |
| Sedimentation time | N/A (240 s) | 120–600 s (240 s) |
| Wash cycles | Standard (1) or High wash (2) (Standard) | 0–3 (1) and 0–3 (0) |
| Hang bag validation | N/A (Yes) | Flag (Yes) |
| Manual extraction | N/A (No) | Flag (No) |
| Product filling speed | N/A (60 mL/min) | 17–120 mL/min (60 mL/min) |
| Waste extraction speed | N/A (75 mL/min) | 17–120 mL/min (75 mL/min) |
1 The selected parameters are in brackets. If the parameter is not available (N/A), the brackets are the default parameters.
T cell enrichment and activation
CD3+ cells were enriched using the EasySep Release Human CD3 Positive Selection Kit according to the manufacturer’s instructions. Cell culture medium was prepared as described in “Comparison of T cell enrichment methods”. T cells were activated using ImmunoCult Human CD3/CD28/CD2 T cell Activators according to the manufacturer’s protocol. Cells were inoculated into 1 L Erlenmeyer cell culture flasks (Corning) at a density of 1.5 × 10⁶ cells/mL. Cells were cultured in an incubator (37°C, 5% CO2, 90 rpm) on a MaxQ CO2 Plus Shaker for 1 day to activate before further manipulations were performed.
Transduction and culture
For large-scale transduction, cells were counted 1 day after activation and 220 mL of cell suspension was transferred to a 600 mL transfer pack (Fresenius Kabi). A volume of LV-eGFP corresponding to a MOI of 2.5 was diluted in 20 mL of culture medium. The medium was the same formulation used in activation. The virus was transferred to a sterile syringe (BD Biosciences) and kept on ice. The cells and virus were welded onto the CT-60.1 Sepax™ C-Pro cell processing kit and run on the Sepax™ C-Pro instrument using the SpinOculation C-Pro application (Table 2).
Table 2. SpinOculation C-Pro parameters
| Parameter | Value |
|---|---|
| Initial volume | 220 mL |
| Input bag rinsing | Yes |
| Input bag rinse volume | 50 mL |
| Pause input bag rinsing | No |
| Optical cell detection | No |
| Intermediate volume | 40 mL |
| Wash cycles | 0 |
| Concentration g-force | 400 × g |
| Concentration time | 300 sec |
| Virus volume | 25 mL1 |
| Spinoculation time | 90 min |
| Spinoculation g-force | 600 × g |
| Final volume | 100 mL |
| Spinoculation volume | 60 mL |
1 Though the volume of lentiviral vector in culture medium was 20 mL, a value of 25 mL was entered here to avoid a hold-up volume in the line.
Cells were counted and inoculated back into 1 L Erlenmeyer cell culture flasks at the original density prior to transduction in fresh culture medium. Cells were cultured for 16 to 20 h in an incubator under the same conditions used for activation. After 16 to 20 h, culture medium was added to double the volume. Cells were cultured for an additional 2 days.
Cell expansion
A 2 L Xuri™ Cellbag bioreactor was placed on a Xuri™ Cell Expansion System W25 filled with 5% CO2, and a reservoir containing culture medium was aseptically welded on. The medium was the same formulation used in small-scale culture. An initial volume of 200 mL culture medium was added to the bioreactor and allowed to equilibrate overnight. The system parameters were set at 37°C, gas flow rate of 0.05 L/min, and a rocking rate of 10 rpm at a 6° angle.
After a total of 4 days in Erlenmeyer shake flasks, cells were inoculated into the bioreactor and culture medium added, giving a total of 500 mL of culture in the bioreactor. Once initiated, the bioreactors were left overnight while fresh medium was added to the reactor at 1 L/d to reach a total volume of 1 L. From day 5 onwards, 1 L of medium/d was continuously perfused to control lactate, ammonium, and glucose levels. Daily sampling was performed for cell number, viability and biochemical analysis (lactate, ammonium, glucose, and pH). Cells were maintained in culture until day 8.
Phenotypic analysis and transduction efficiency
T cell populations were analyzed by flow cytometry on days 0, 4, and 8 of culture. Briefly, 1 × 10⁶ cells were washed and blocked with human FcR Blocking Reagent (Miltenyi Biotec) prior to staining with CD3-BV510, CD4-APC-H7, CD8-BV650, CD45RO-BV421, CD62L-PE, CD25-BV786, CD279-APC and 7AAD (all from BD Biosciences).
Transduction efficiency was measured using eGFP detection on the fluorescein isothiocyanate (FITC) channel simultaneously with the phenotypic analysis. The stained cells were analyzed on the CytoFLEX Flow Cytometer.
Harvest and cryopreservation
T cells were harvested using the Sefia™ instrument, FlexCell application and CT-800.1 kit (Table 3). Briefly, 1 × 10¹⁰ T cells were reduced in volume to 50 mL at 75 mL/min flow rate. Two wash cycles were performed using PLASMA-LYTE A (Baxter) supplemented with 10% human serum albumin (Gemini). Washes were performed at 400 × g for 5 min. Cells were then extracted at 1 × 10⁸ cells/mL in PLASMALYTE A with 50% CryoStor™ CS10 (BioLife Solutions) and 5% human serum albumin into three CryoMACS™ 50 freezing bags (Miltenyi Biotec). The three cryogenic bags were loaded into the VIA Freeze™ Quad freezer with a cooling rate of -1°C/min until the temperature reached -100°C. After freezing, all cells were transferred to liquid nitrogen storage.
Table 3. Parameters used in the FlexCell Protocol Software
| Parameter | Value |
|---|---|
| Initial volume | Input volume of 1 × 10¹⁰ cells (mL) |
| Detect initial volume | No |
| Enable initial bag weight sensor | No |
| Enable waste bag weight sensor | Yes |
| g-force, concentration | 400 × g |
| Sedimentation time, concentration | 300 s |
| Wash cycles | 0 |
| Concentration g-force | 400 × g |
| Concentration time | 300 sec |
| Intermediate volume, concentration | 50 mL |
| Pump speed | 75 mL/min |
| Wash cycles | 2 |
| g-force, washing | 400 × g |
| Sedimentation time, washing | 300 s |
| Intermediate volume, washing | 20 mL |
| Final volume bag 1 | 20 mL |
| Final volume bag 2 | 20 mL |
| Final volume bag 3 | 20 mL |
| Switch bag for resuspension | No |
| Dead volume extraction | No |
| Enable process temperature | No |
| Process temperature | 20°C |
| Enable final product temperature | Yes |
| Final product temperature | 4°C |
| Final product conditioning time | 0 s |
| Enable final dilution | Yes |
| Final dilution injection rate | 17 mL/min |