Although protein L affinity resins have been available for more than a decade, insufficient binding capacities and alkaline stability challenges have limited their use in productive manufacturing processes. The MabSelect™ VL protein L resin now offers improved alkaline stability compared to Capto™ L resin and a two-fold or more increase in dynamic binding capacity (DBC) in certain applications.
In this study, we examined dynamic binding capacities of MabSelect™ VL and Capto™ L resins from Cytiva, TOYOPEARL® AF-rProtein L-650F resin from Tosoh Bioscience, and KanCap L affinity chromatography resin from Kaneka. Results show that, compared to TOYOPEARL® AF-rProtein L-650F and KanCap L resins, MabSelect™ VL resin’s mean binding capacity was higher for both fragment antigen binding (Fab) and domain antibody (dAb). For mAb, MabSelect™ VL resin and TOYOPEARL® AF-rProtein L-650F resin demonstrated similar binding capacities at a residence time (RT) of 2.4 min, with MabSelect™ VL resin showing significantly higher binding capacities at longer RTs.
Results
Comparison of binding capacity
mAb
Figure 1 shows the results from our study using mAb samples and the following four protein L chromatography resins: MabSelect™ VL, Capto™ L, TOYOPEARL® AF-rProtein L-650F, and KanCap L resins.
- For a RT of 2.4 min, TOYOPEARL® AF-rProtein L-650F resin and MabSelect™ VL resin each had a similar dynamic binding capacity (p = 0.9938) at 10% breakthrough (QB10). At longer RTs, the mean QB10 for MabSelect™ VL resin was significantly higher compared to TOYOPEARL® AF-rProtein L-650F resin (p < 0.0001 for RTs of 4, 6, and 10 min).
- The mean QB10 for MabSelect™ VL resin was significantly higher compared to Kaneka’s KanCap L resin for all residence times covered in this study (p < 0.0001 for all RTs tested).
- MabSelect™ VL resin’s predecessor, Capto™ L resin, has relatively consistent QB10 findings for mAbs at all RTs tested but a significantly lower capacity compared to MabSelect™ VL resin (p < 0.0001 for all RTs tested). Compared to Capto™ L resin, MabSelect™ VL resin offers a more than two-fold increase in mean QB10 for RTs of 6 and 10 min (Fig 1).
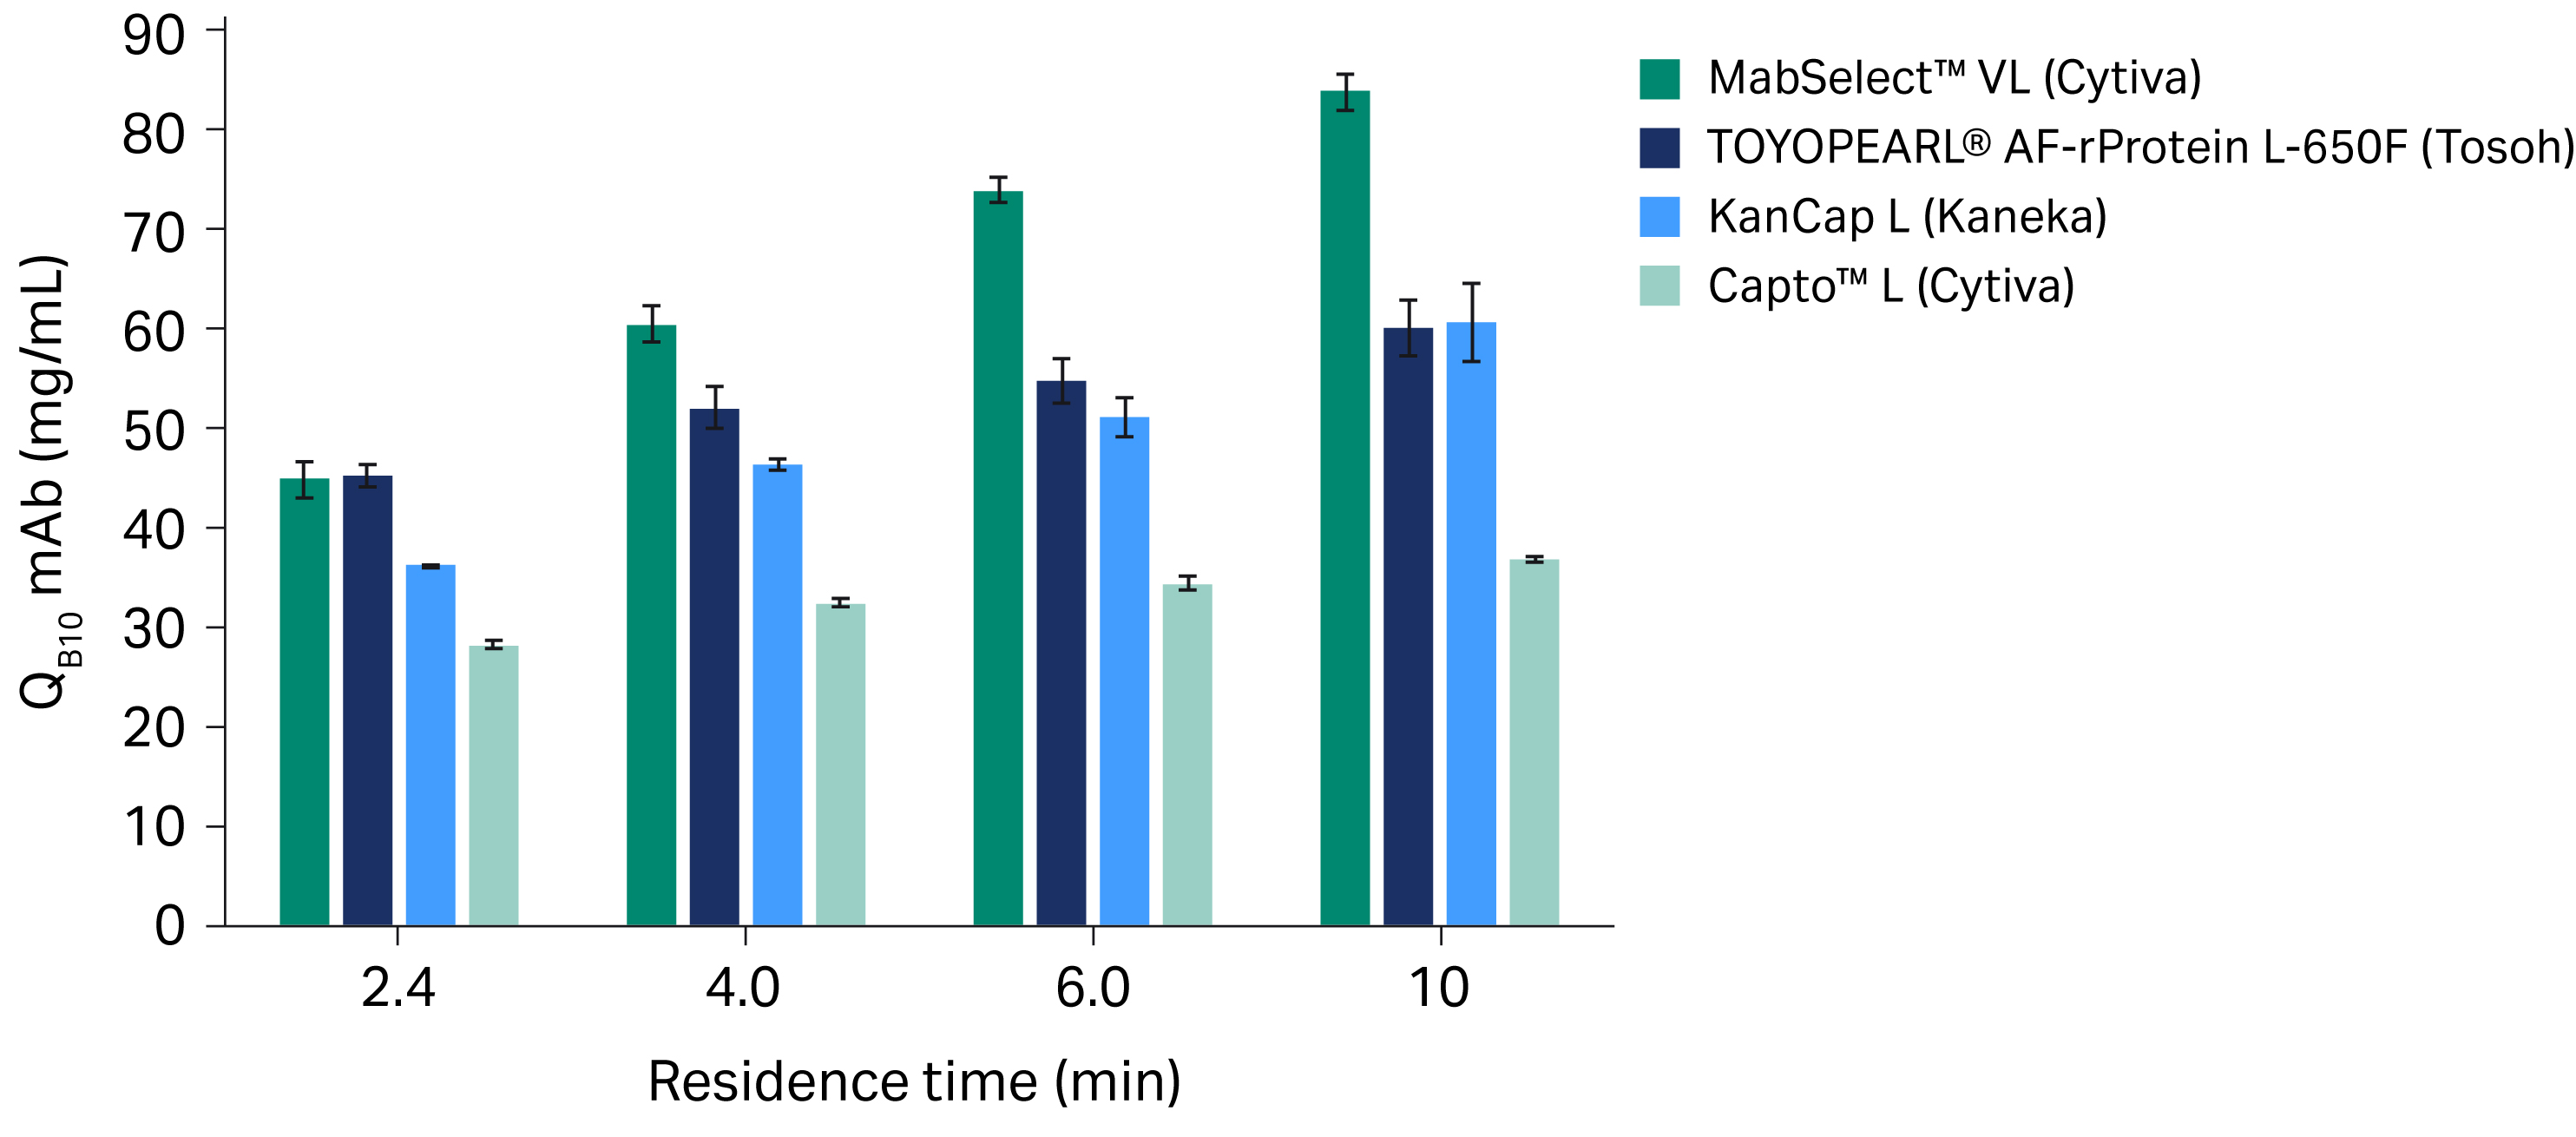
Fig 1. Mean QB10 for protein L chromatography resins with mAb samples at different residence times. All experiments were run in triplicate; error bars show standard deviations.
Fab
The results from our study with Fab samples are presented in Figure 2.
- We observed a three-fold increase in mean QB10 of MabSelect™ VL resin compared to Capto™ L resin for all RTs (p < 0.0001 for all RTs tested).
- KanCap L resin and TOYOPEARL® AF-rProtein L-650F resin both performed significantly better than Capto L resin for all RTs (p < 0.0001 for all RTs tested).
- Compared to TOYOPEARL® AF-rProtein L-650F resin, the mean QB10 was found to be 15-18% higher for MabSelect™ VL resin for the RTs evaluated in this study (p < 0.0001 for all RTs tested).
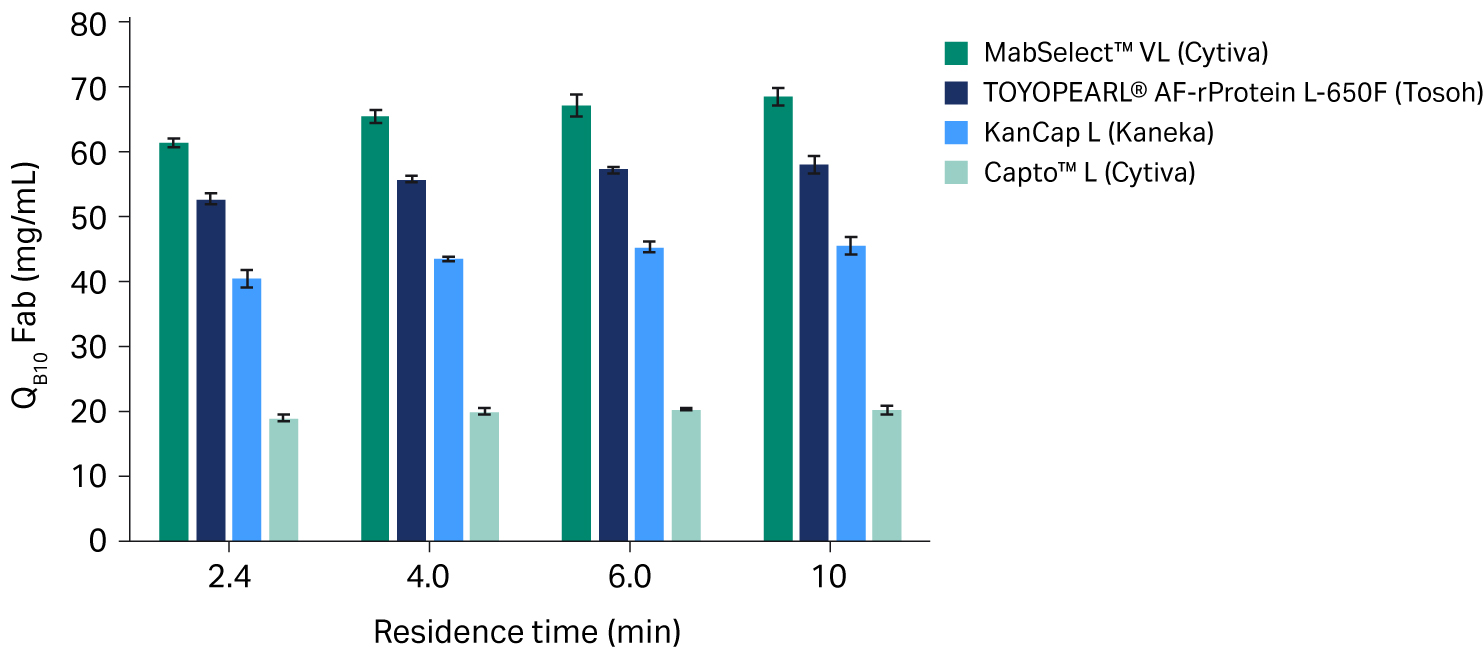
Fig 2. Mean QB10 for protein L chromatography resins with Fab samples at different residence times. All experiments were run in triplicate; error bars show standard deviations.
dAb
A dAb is smaller in size than a mAb and utilizes more binding domains, resulting in faster mass transfer kinetics and making it such that the QB10 is relatively unaffected by RT (Fig 3). Our results show the following:
- MabSelect™ VL resin offers significantly improved binding capacities compared to Capto™ L, TOYOPEARL® AF-rProtein L-650F, and KanCap L resins for all residence times (p < 0.0001 for all RTs tested).
- MabSelect™ VL resin's mean binding capacity was at least 1.6 times greater than the next best performing resin at all RTs.
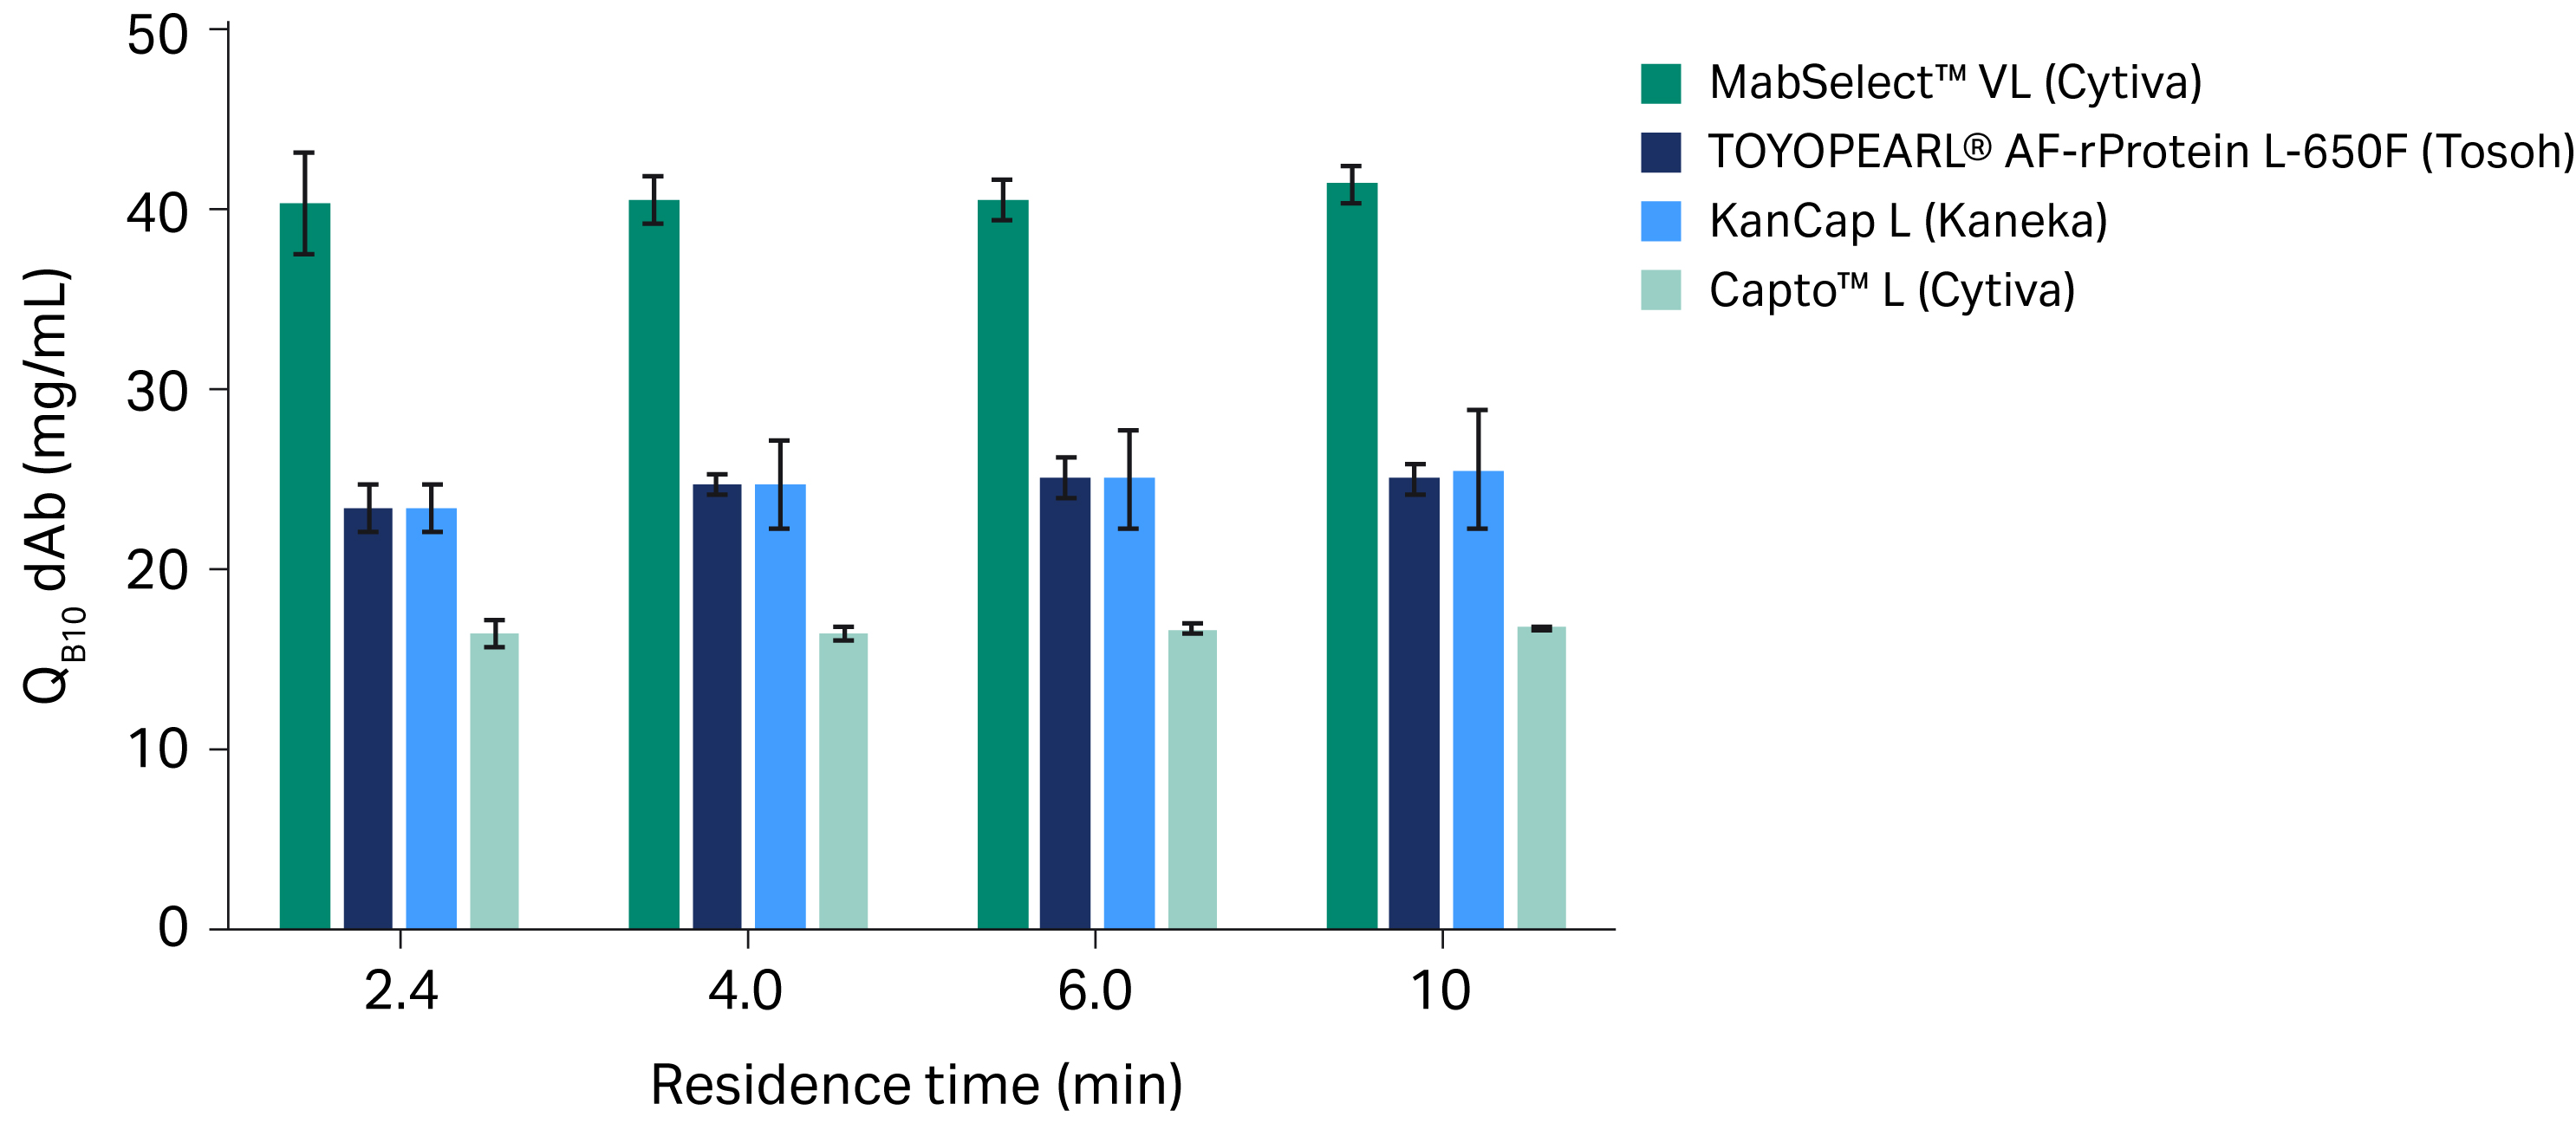
Fig 3. Mean QB10 of protein L chromatography resins with dAb samples at different residence times. All experiments were run in triplicate; error bars show standard deviations.
Comparing dynamic binding capacities of different sample types
When comparing the different types of molecules — mAb, Fab, and dAb — the overall QB10 values in mg/mL is less for dAb, due to the molecule’s small size. When comparing QB10 in mol/L, the molar capacities are higher overall for dAb compared to mAb and Fab (Fig 4).
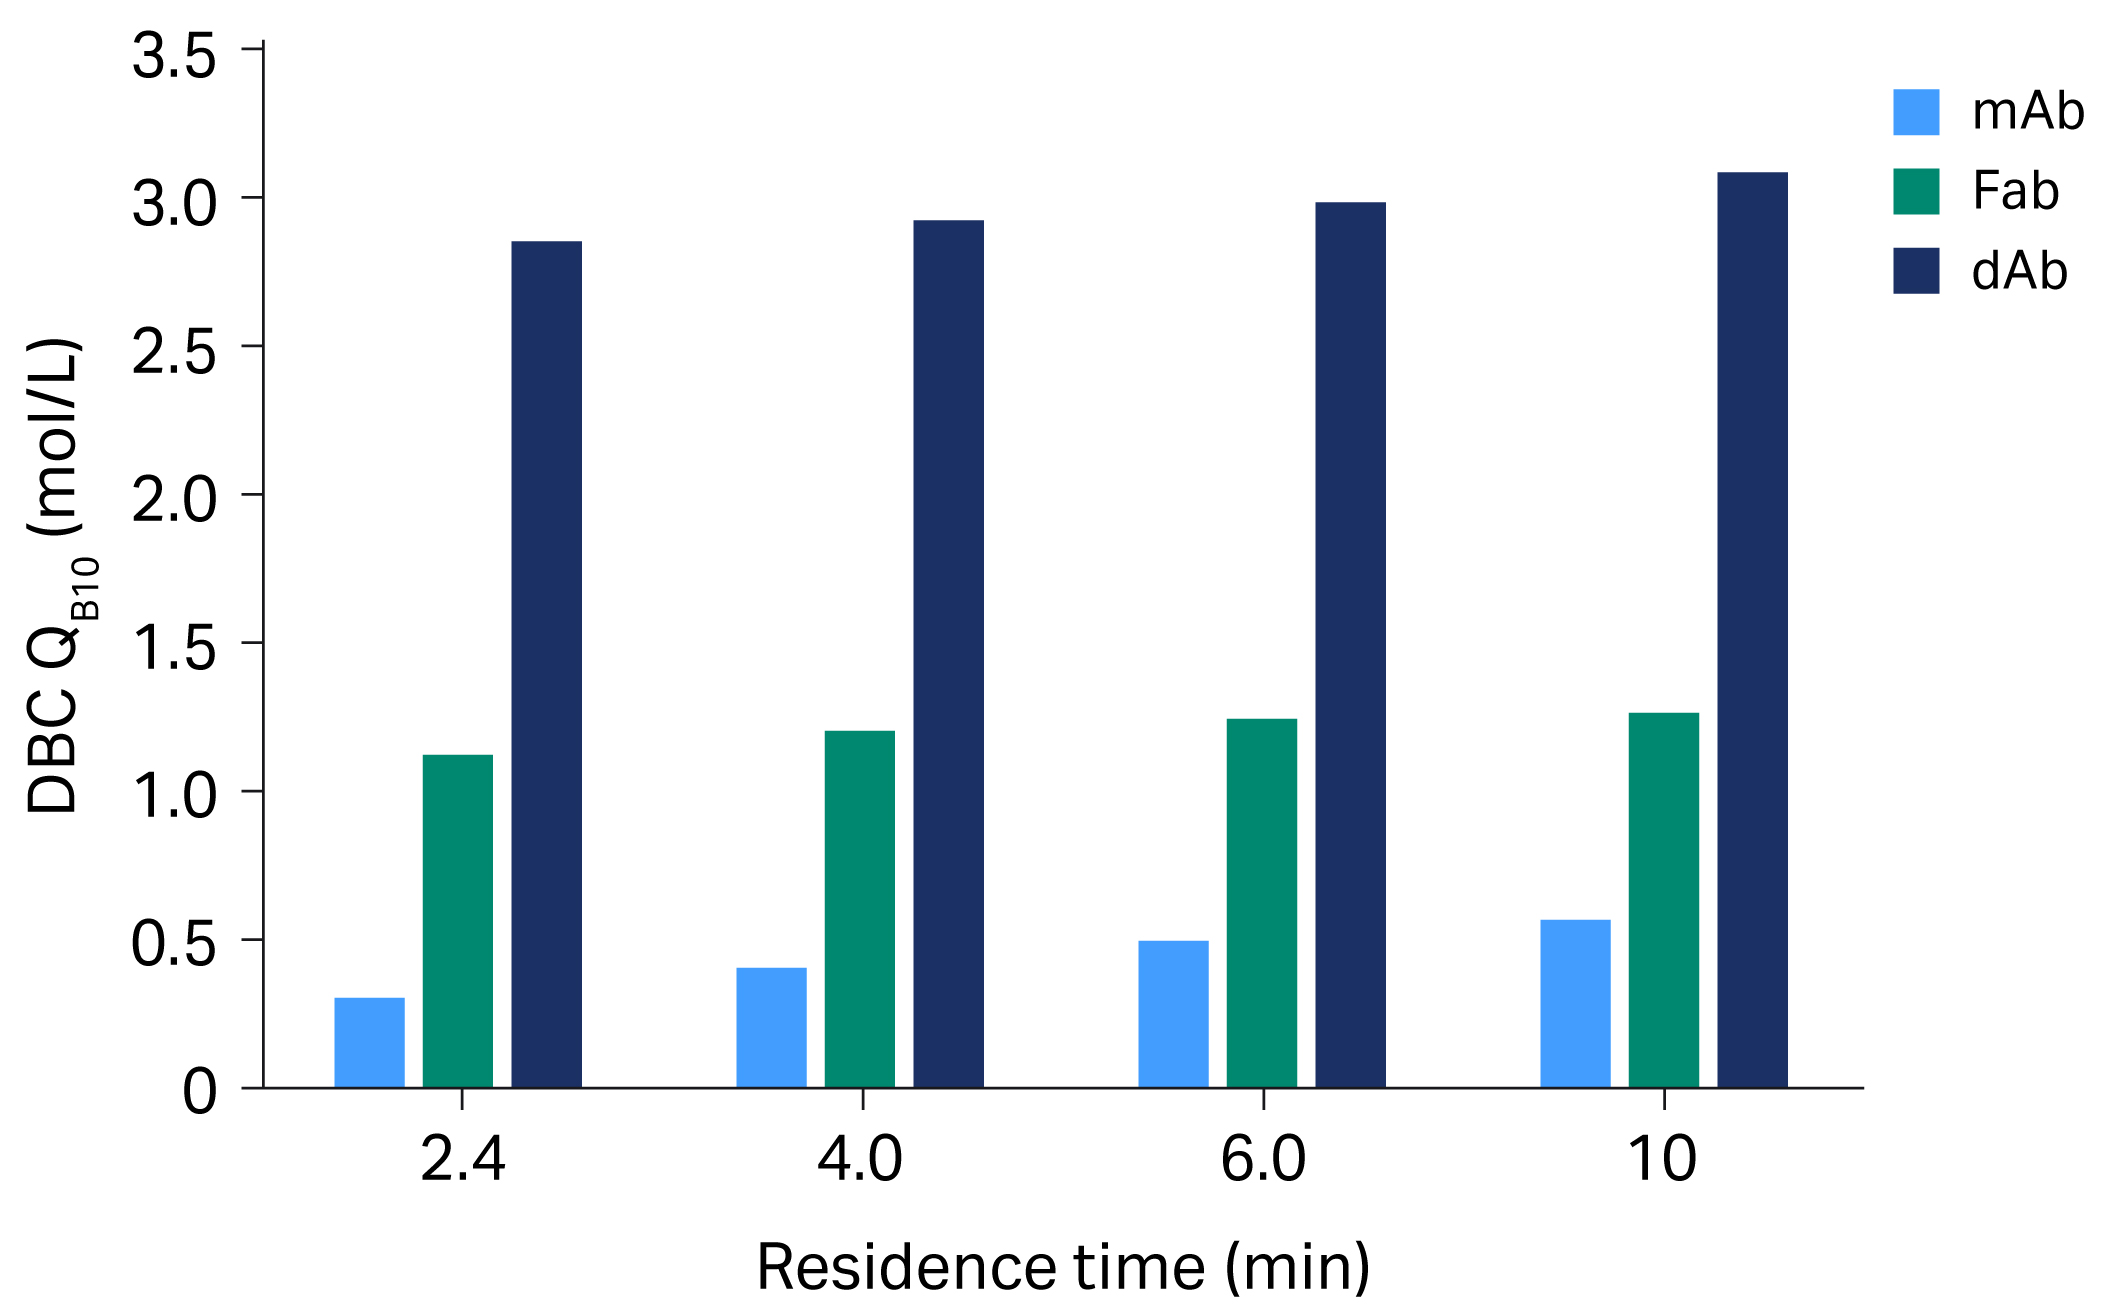
Fig 4. DBC with MabSelect™ VL resin for dAb is unaffected by residence time. The molar binding with dAb is around 10 times higher compared with mAb.
Conclusions
For mAb samples, MabSelect™ VL resin showed a significantly higher binding capacity versus all other resins tested at longer RTs of 4, 6, and 10 min (p < 0.0001 for RTs of 4, 6, and 10 min). The binding capacities were similar for MabSelect™ VL resin and TOYOPEARL® AF-rProtein L-650F resin at shorter RTs up to 2.4 min (p = 0.9938).
For Fab and dAb samples, MabSelect™ VL resin binding capacities are significantly higher compared to TOYOPEARL® AF-rProtein L-650F resin and KanCap L resin at all RTs (p < 0.0001 for all RTs tested).
The increased binding capacity offered by MabSelect™ VL resin makes it a suitable option for productive manufacturing processes, adding another tool for antibody capture chromatography.
*All p values included in this article were determined using an ANOVA followed by post-hoc ANOVA multiple mean comparisons using Tukey-Kramer HSD (honestly significant difference) statistical test.
CY31919-20Feb23-AN
Comparison of binding capacity
We have performed a benchmarking study on MabSelect™ VL and Capto™ L resins from Cytiva, TOYOPEARL® AF-rProtein L-650F resin from Tosoh Bioscience, and KanCap L resin from Kaneka. QB10, the dynamic binding capacity (DBC) at 10% breakthrough, was determined at different residence times with mAb, Fab, and dAb by frontal analysis on 1 mL or 2 mL resin (volumetric determination by cube to get the exact resin volume). We determined the DBC for resin packed in Tricorn™ 5/50 or Tricorn™ 5/100 columns, respectively. The sample was diluted to 2 mg/mL and was applied to the column during a specific RT. The DBC for each resin was calculated at 10% of the breakthrough capacity. All sample runs were performed in triplicate and the results are presented as averages with standard deviations.
Samples
The test samples for the mAb (trastuzumab) and the dAb are produced in-house. The Fab sample is produced from mAb by papain cleavage as follows: the trastuzumab solution is adjusted to a pH of 7.4 by addition of 0.5 M sodium phosphate and then diluted as follows: 1 part trastuzumab solution plus 1 part digestion buffer (25 mM Na-phosphate, 1 mM EDTA, 5 mM mercapto-ethanol, pH 7.5). Papain crystals are added to the solution and the solution is incubated at 37°C overnight. Antipain (papain inhibitor) is then added to the digested mAb. The solution is left in room temperature for 30 min prior to application onto a HiScale™ 26 column packed with Capto™ L resin to remove Fc-containing molecules collected in flow through. Fab and partially digested mAb containing variable region of kappa light chains are collected during elution. The elution pool is then applied onto a HiScale™ 16 column packed with a protein A prototype resin that only binds Fc. Fab is collected in the flow through.