Fetal bovine serum (FBS) is still used in many cell culture applications, including viral vector production. FBS from a single origin may be limited, so qualifying FBS from other origins is one way to enhance security of supply. With that in mind, we evaluated HyClone brand characterized FBS from the United States, New Zealand, and Australia on several performance metrics. We observed low intra- and inter-lot variation in all measured parameters suggesting equivalence of the sera we evaluated.
Introduction
Fetal bovine serum (FBS) is used as a media supplement for most adherent in vitro cell culture applications in academia and industry. FBS contains a complex mix of proteins, hormones, and growth factors that many different cells and cell lines require to grow in vitro. Although the industry trend is to change from using adherent cells with serum to using suspension-adapted cells and chemically defined cell culture media, many applications still require serum supplementation. Among these applications are virus production for gene therapy and vaccines.
New Zealand origin FBS is commonly selected at early stages, as the serum is obtained from a closed herd. Thus, serum supply from this origin is limited. To ensure security of supply for research, clinical, and full-scale manufacturing, it is important to consider secondary sources from other origins. However, FBS from those source(s) must meet required performance and quality standards.
Controlling process variability is another key aspect of therapy development and production. This includes understanding and managing variability within and between lots of serum from a given source. FBS is produced as a byproduct from the dairy and meat industry, and lot-to-lot variations could potentially be observed.
With all of this in mind, we evaluated and compared HyClone characterized FBS originating from the United States, New Zealand, and Australia for cell culture and production performance. Experiments used adherent HEK293T cells with HyClone DMEM supplemented with 10% FBS and examined:
- General morphology
- Cell growth kinetics and population doubling times
- Viability
- Transfection efficiency after PEI-based adeno-associated virus serotype 2 (AAV2) transfections
- Virus production after PEI-based AAV2 transfections
The results from the study clearly demonstrate no discernible effects for cell culture kinetics, morphology, transfection efficiency, or virus production in adherent HEK293T cells cultured in HyClone DMEM supplemented with 10% FBS from the United States, New Zealand, or Australia. Furthermore, we observed no differences for any of the analyzed parameters when evaluating intra-lot or lot-to-lot variations for the included samples.
Results and discussion
View serum study Materials and methods.
Cell morphology and growth kinetics
We conducted the HyClone FBS evaluation using three flasks per lot and three lots per country of origin, resulting in n=27 individual experimental conditions. After thawing of cryopreserved cells and passaging, we assessed general morphology, cell growth kinetics, and population doubling times (PDTs). All n=27 sera conditions were included and cultured in parallel T25 cell culture flasks. Cells were monitored and passaged twice a week. PDTs and viability were recorded over time.
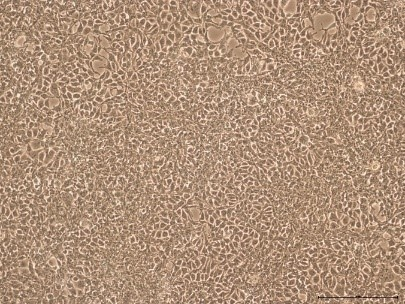
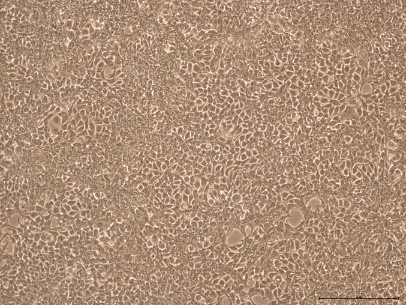
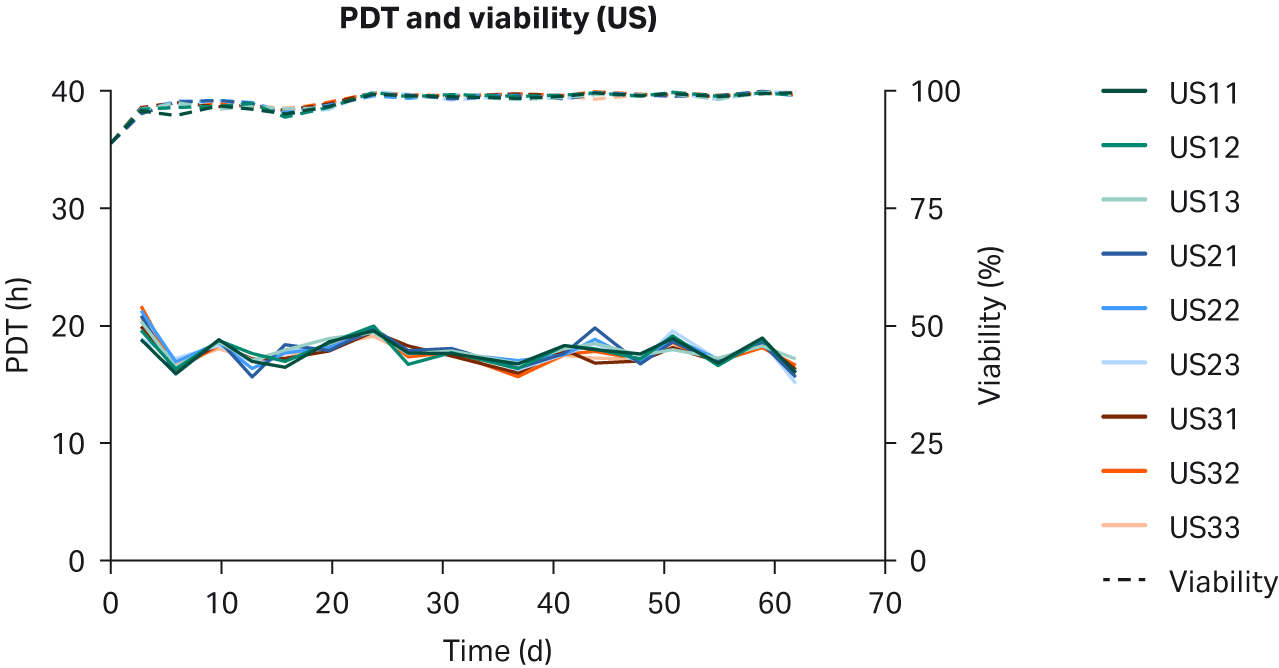
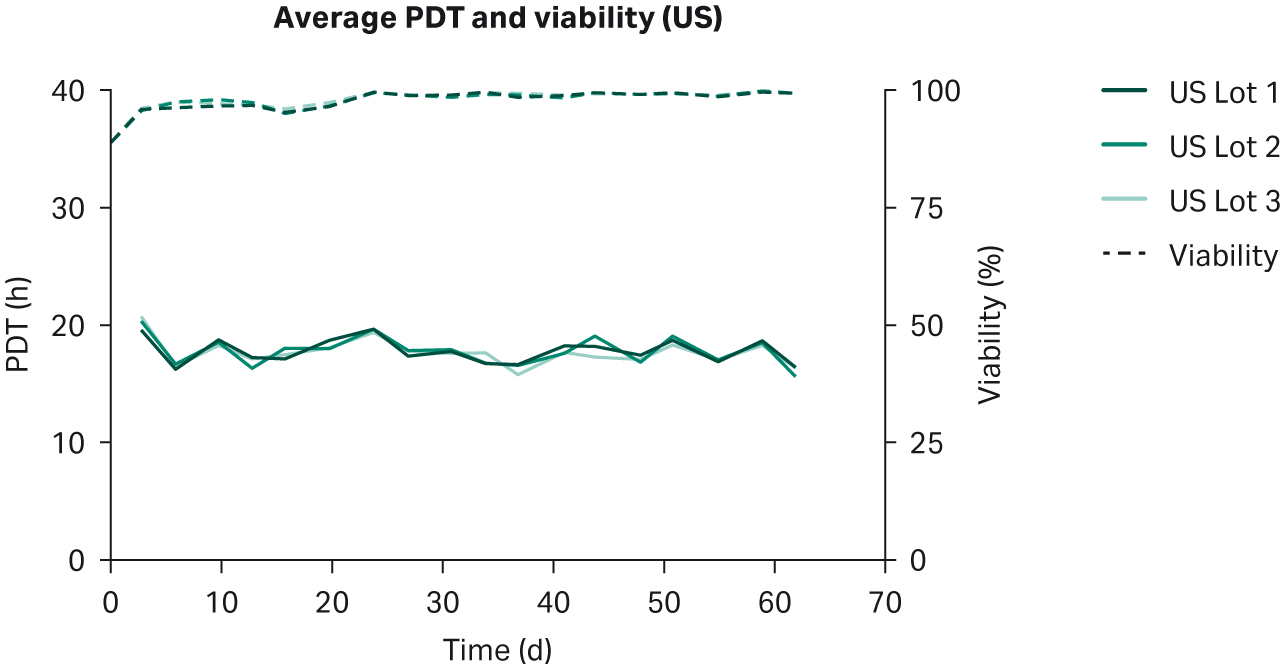
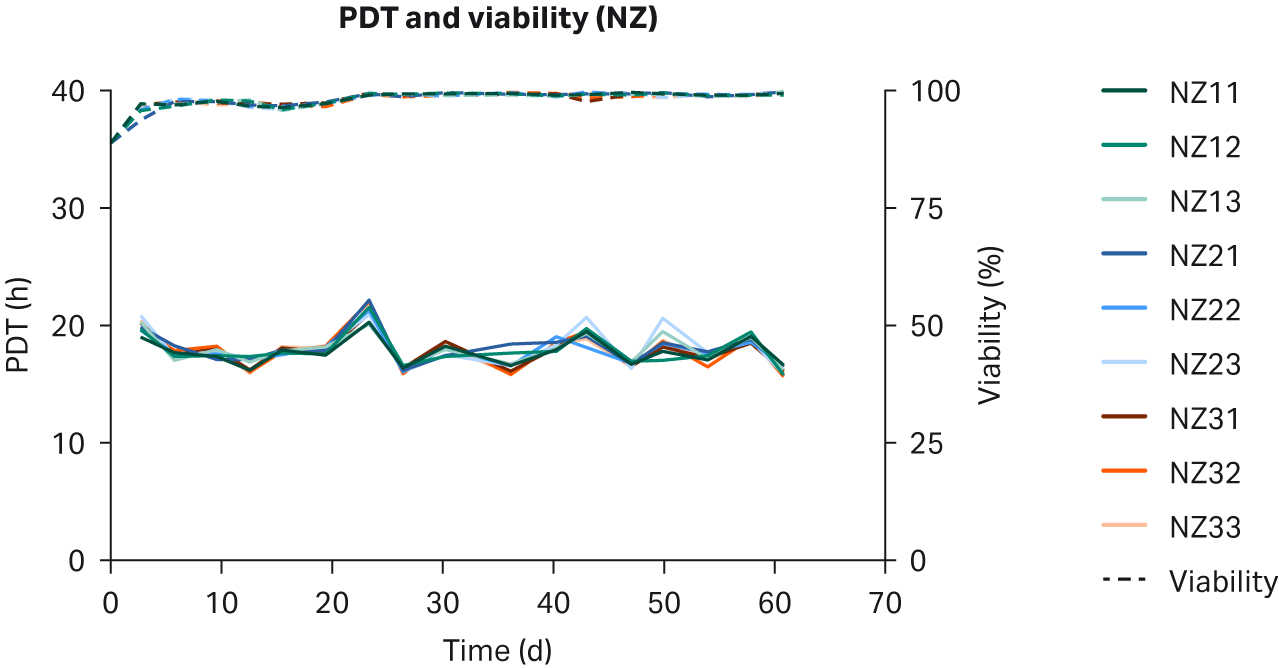
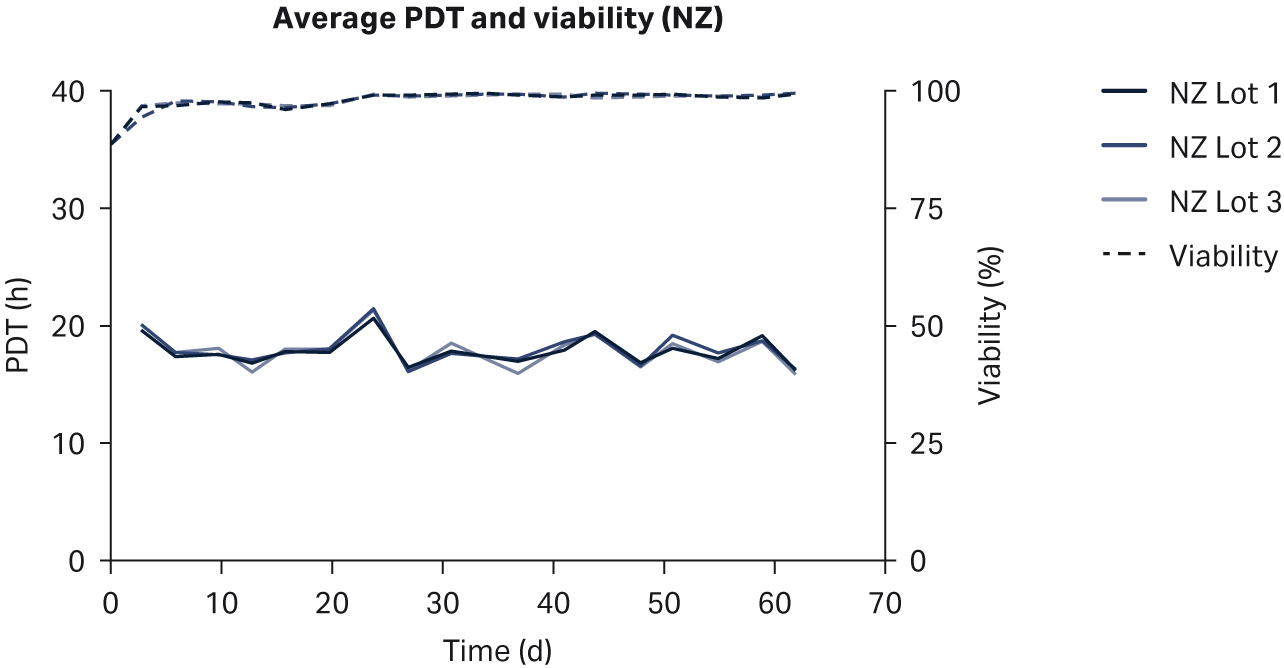
We observed no differences in cell morphology when comparing HEK293T cells cultured in DMEM supplemented with any sera (Fig 1). Further, we observed no differences for individual PDTs (Fig 2), average lot PDTs (Fig 2), average PDTs per country over time (Fig 3A), or overall combined average PDTs (Fig 3B).
A)
B)
C)
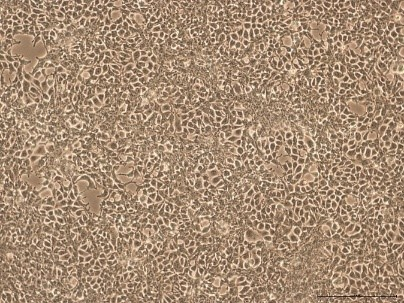
Fig 1. Representative images of cell morphology in HEK293T cells cultured in DMEM supplemented with 10% FBS from (A) US; (B) NZ: (C) AUS. 10× magnification.
A)
B)
C)
D)
E)

F)
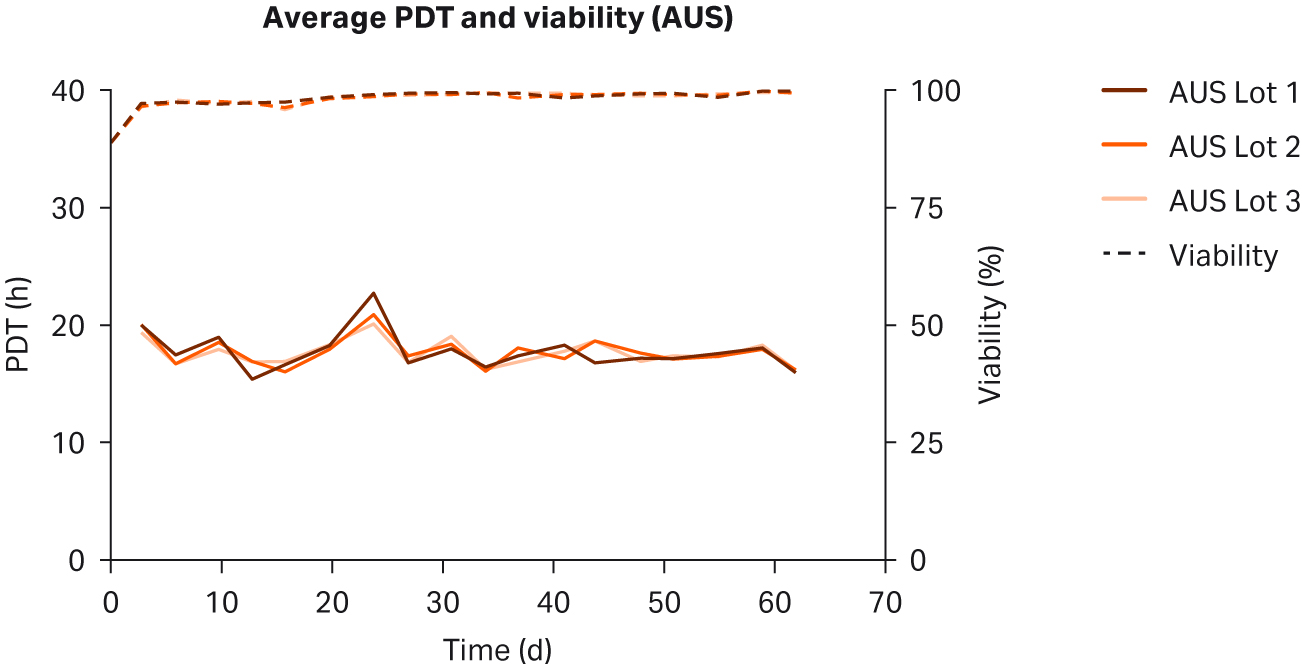
Fig 2. Individual PDTs, average PDTs per lot, and viabilities for HEK293T cells cultured in DMEM supplemented with 10% FBS from (A, B) US; (C, D) NZ; (E, F) AUS. Replicates are designated as 1, 2, and 3 following the lot number (e.g., US23 is lot 2, replicate 3).
A)
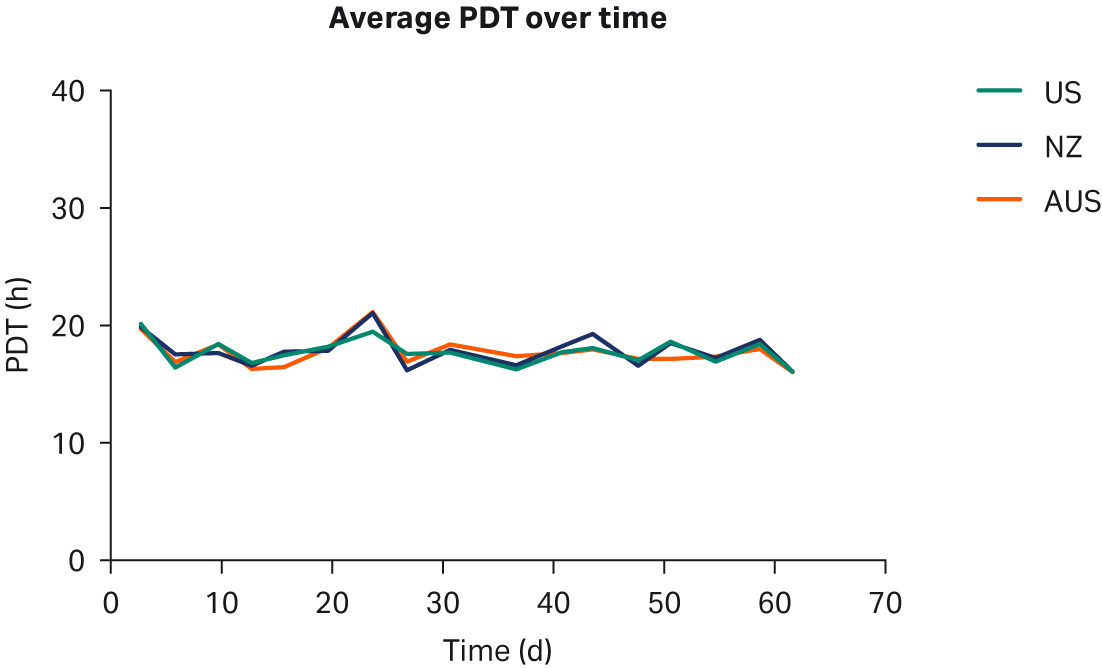
B)
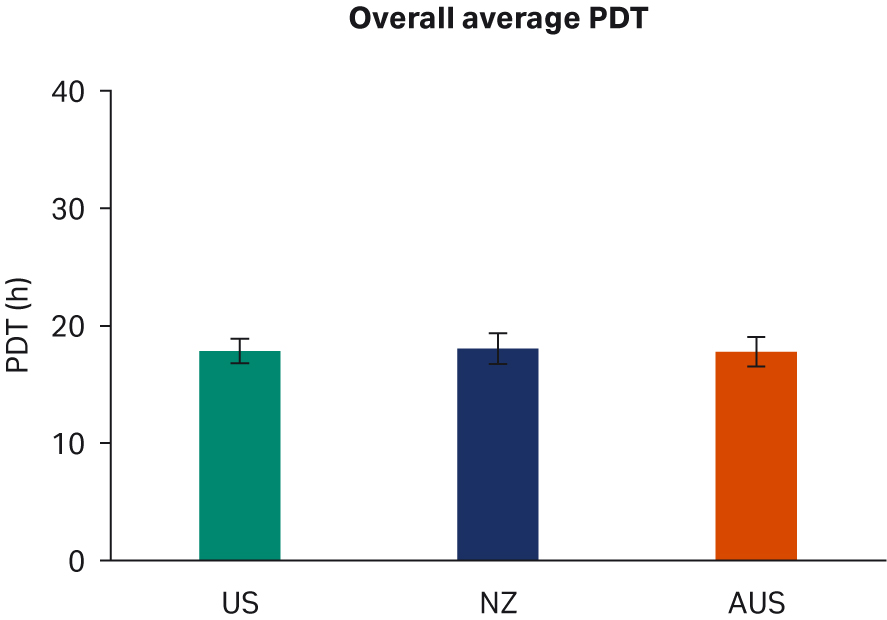
Fig 3. (A) average PDTs over time; (B) overall average PDTs per country. Depicted error bars are standard deviations.
Transfection and transfection efficiency
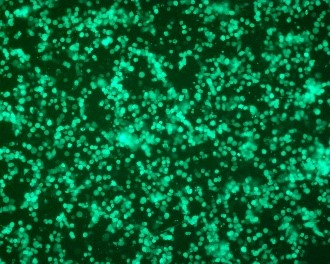
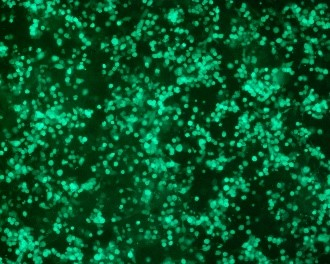
Seventy-two hours after AAV2 transfection and prior to harvest, we monitored transfected cells for green fluorescence protein (GFP) expression using a fluorescence microscope. Images for selected samples were saved and compared as both brightfield and fluorescence images. We observed no differences in overall cell morphology or fluorescence after transfection (Fig 4).
A)

B)
C)

D)
E)

F)
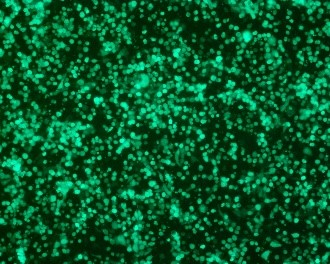
Fig 4. Representative (L) brightfield and (R) fluorescence microscopy images 72 h after AAV2 transfection of HEK293T cells cultured in DMEM supplemented with 10% FBS from (A, B) US; (C, D) NZ; (E, F) AUS.
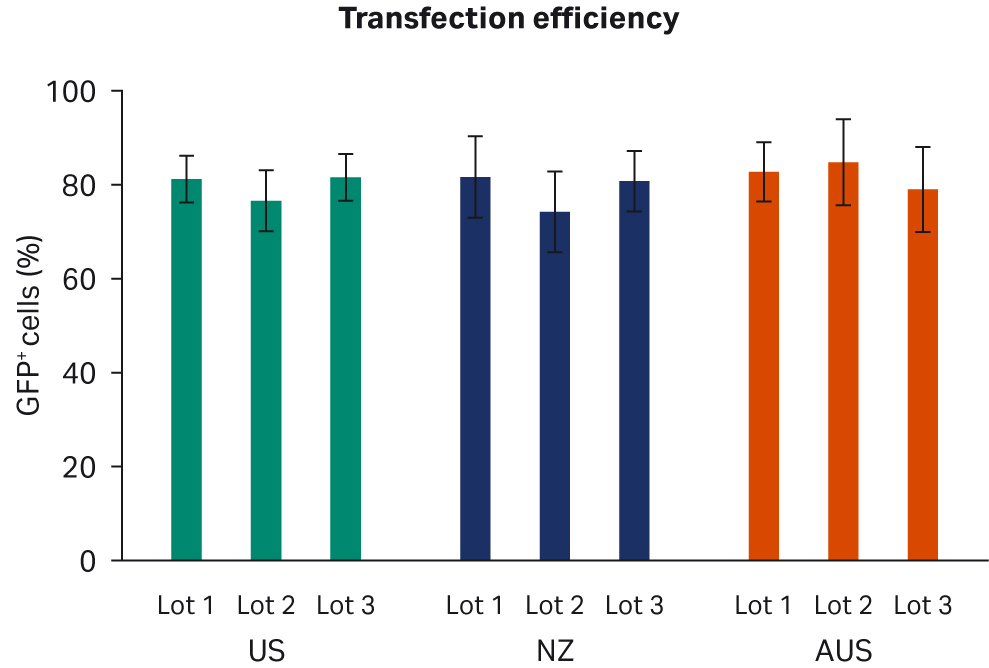
We analyzed transfection efficiency by flow cytometry, with a gating strategy to quantify the fraction of GFP+ cells among all live cells in each sample. Two transfection experiments with duplicate samples were carried out. We observed no discernible differences when comparing transfection efficiencies per FBS lot (Fig 5A) or overall per country of origin (Fig 5B).
A)
B)
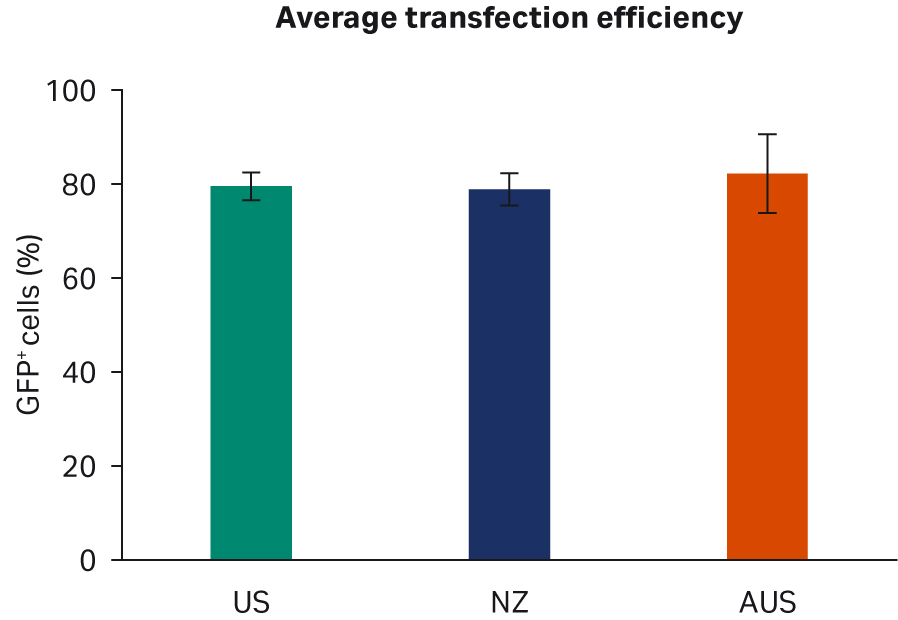
Fig 5. Average AAV2 transfection efficiency 72 h post-transfection (A) per lot. (B) per country. All data are depicted with standard deviations.
Virus titers
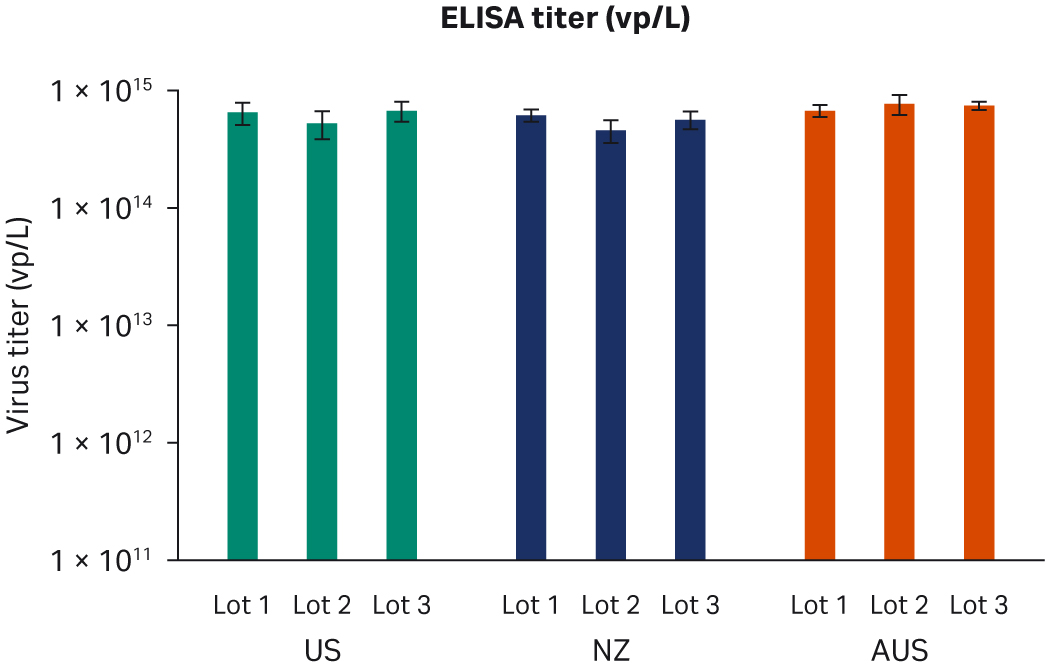
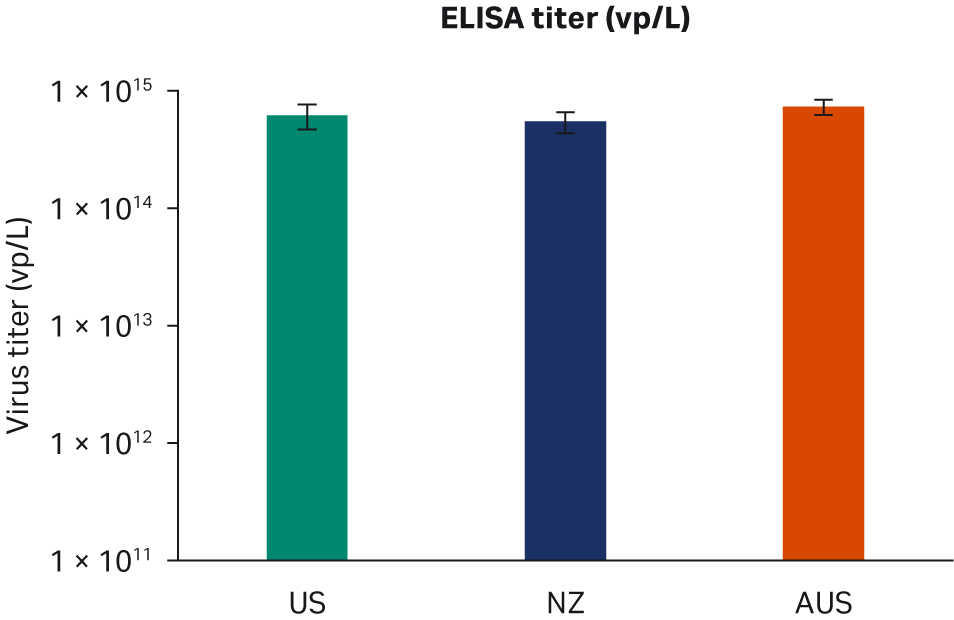
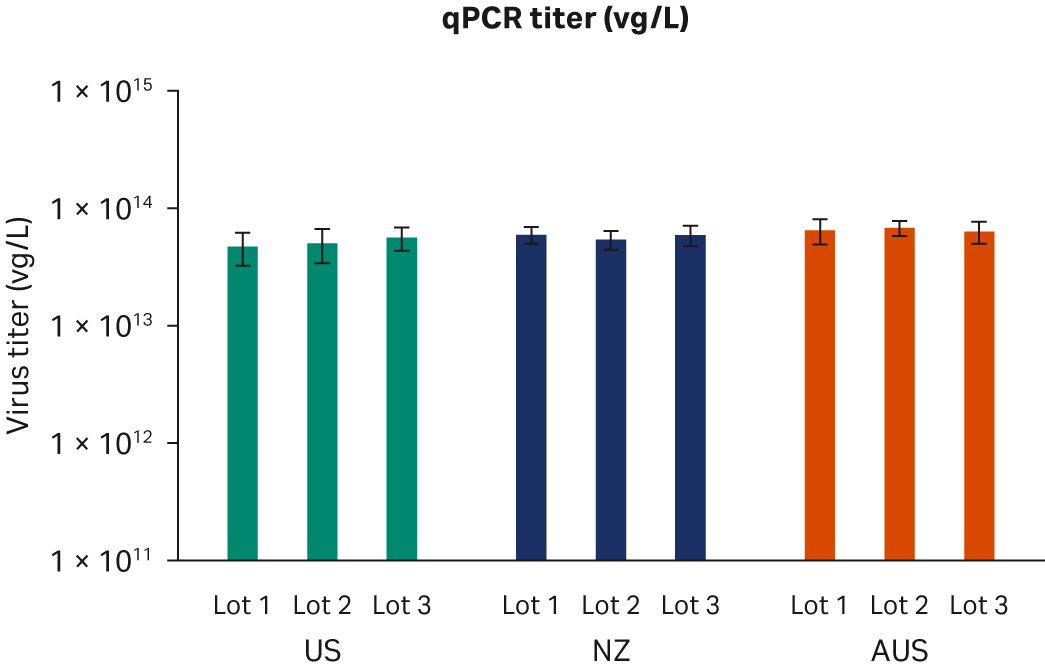
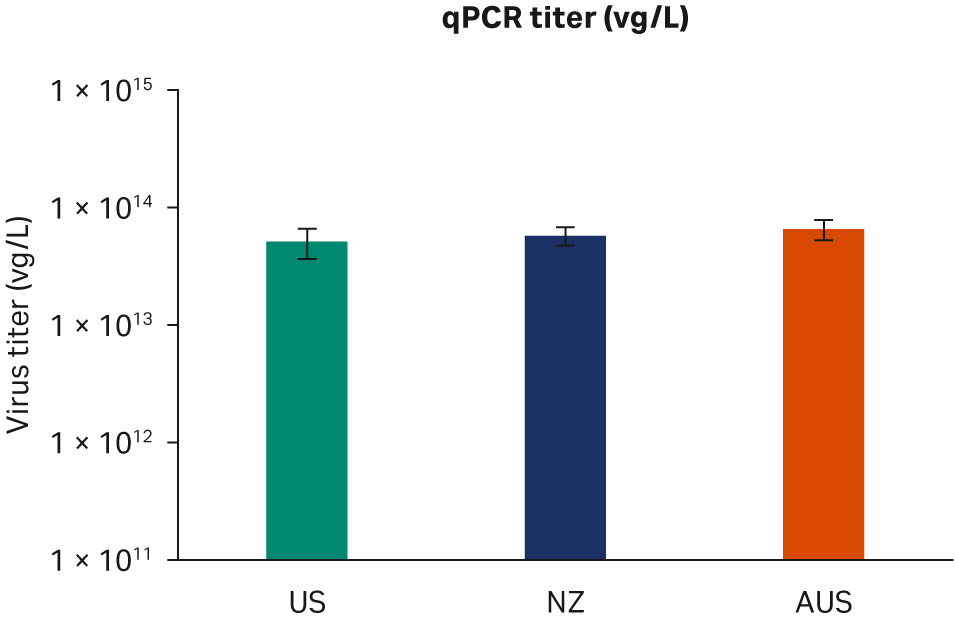
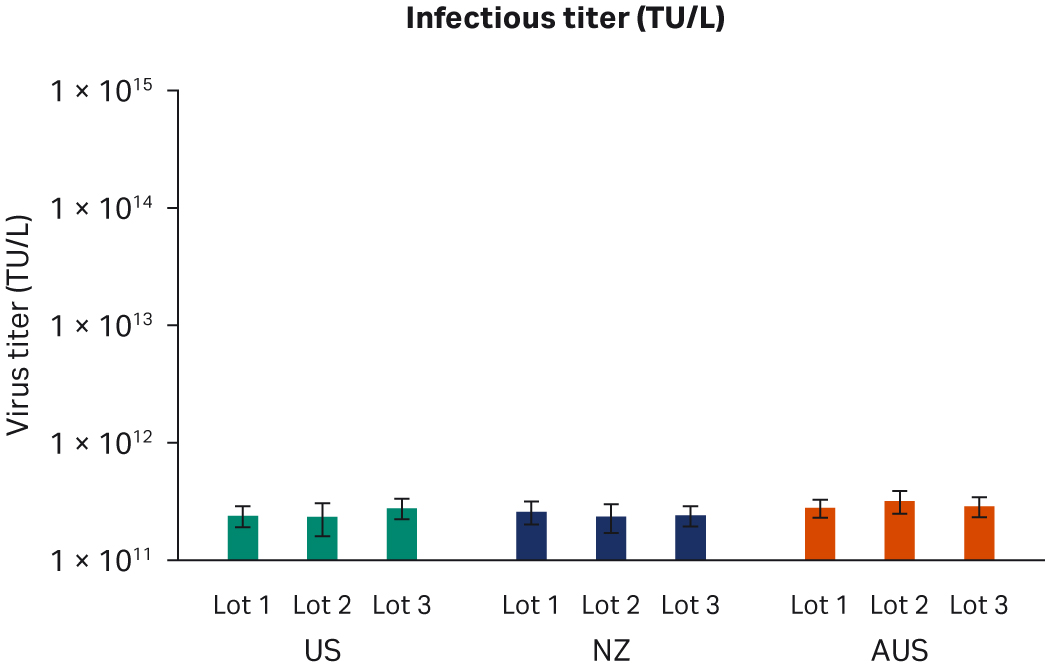
Seventy-two hours post-transfection, we harvested samples and freeze-thawed them three times at -80°C. After the repeated freeze-thaw cycles, samples were centrifuged at 10 000 × g to clarify supernatants and aliquoted for virus titer analyses using enzyme-linked immunosorbent assay (ELISA), qPCR, and transduction assay analyses. All samples from two transfection experiments were tested twice in duplicated runs using all three methods. We observed no differences for ELISA, qPCR, or infectious virus titers when comparing all FBS lots (Fig 6A, C, E, respectively) or overall per country of origin (Fig 6B, D, F, respectively).
A)
B)
C)
D)
E)
F)
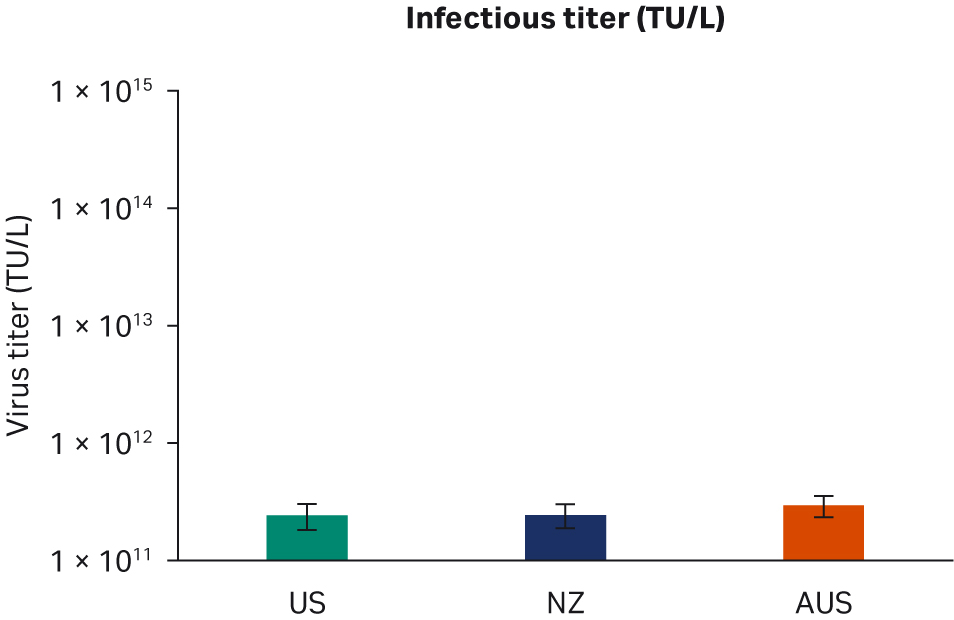
Fig 6. Results from two separate transfection experiments. (A, B) average ELISA virus titers; (C, D) qPCR virus titers; (E, F) infectious virus titers, per FBS lot and per country, respectively. All data are presented as average virus titer/L with standard deviations.
Conclusions
In this study, we evaluated HyClone brand FBS from three different countries, using three separate lots per country and three flasks per lot, resulting in a total of n=27 different conditions compared in parallel. FBS performance was evaluated using a single adherent HEK cell line. The observed low overall variations suggest that the included FBS lots do not differ in quality or performance; however, no claims are made to extrapolate these results to cover other cell lines or processes.
Given the nature of cell culture experiments in general and the variation that can be seen when comparing multiple cultures over time, the lack of variation in the observed parameters indicate that there were no discernible effects on cell culture kinetics, morphology, transfection efficiency, or virus production in adherent HEK293T cells cultured in HyClone DMEM supplemented with 10% FBS from the United States (US), New Zealand (NZ), or Australia (AUS). Furthermore, we observed no differences for any of the analyzed parameters when evaluating lot-to-lot variations or intra-lot variations for the included samples.
The results clearly demonstrate that there were no observable differences in the performance of Characterized HyClone FBS originating from the United States, New Zealand, or Australia.
About HyClone characterized FBS from US, NZ, and AUS
The manufacturing processes used to create HyClone sera are traceability certified by the International Serum Industry Association (ISIA). To further support product traceability, we were an early adopter of Scientific Traceability by Oritain to prove the country of origin of premium bovine sera products from the United States, Australia, and New Zealand. Premium bovine serum samples from different regions have been analyzed, and Oritain has created a database of the unique 'Origin Fingerprint' exclusive to each country of origin. Figure 7 shows an example of labeling on a bottle of HyClone serum.
Learn more about:
HyClone characterized FBS, U.S. origin
HyClone characterized FBS, New Zealand origin
HyClone characterized FBS, Australia origin
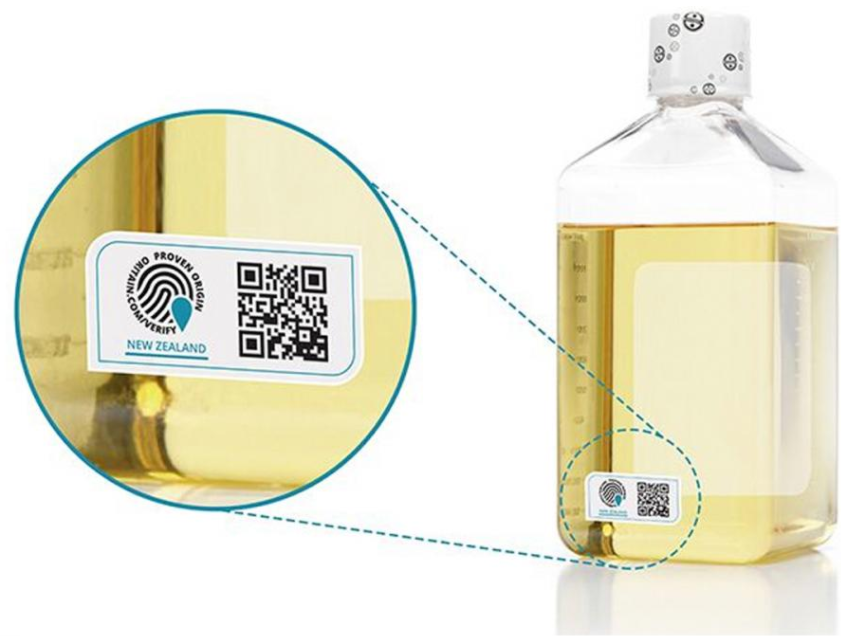
Fig 7. Label on bottle of HyClone serum, New Zealand origin, verifying the country of origin.
Recovery of adherent HEK293T cells after cryopreservation
Cells were thawed in HyClone DMEM/High glucose with L-glutamine and sodium pyruvate (hereafter only referred to as DMEM) (Cytiva) supplemented with 10% of a reference FBS (Gibco; Thermo Fisher), recovered in T25 flasks and scaled up in T75 and T225 flasks. All volumes of media and other reagents were scaled according to flask sizes for each passage (Table 1), to be able to determine PDTs and growth kinetics. Cells were passaged twice per week. For each passage, cells were carefully washed once in HyClone PBS (Cytiva) and then trypsinized using TrypLE™ (Thermo Fisher) for 2 min at 37°C. After this, cells were resuspended in additional complete media and counted, followed by passaging in new media and flasks.
Table 1. Flask sizes, media, and reagent volumes for adherent HEK293T cells
| Flask | Area (cm2) | Media (mL) | TrypLE (mL) | Media added before counting (mL) | Average seeding density per passage (cells/cm2) |
|---|---|---|---|---|---|
| T25 | 25 | 5 | 1 | 2 | 7 × 10³ to 1.5 × 10⁴ |
| T75 | 75 | 15 | 3 | 6 | |
| T225 | 225 | 45 | 9 | 18 |
Cell growth comparison
After five passages of recovery and scaling up, cells were split and seeded in n=27 individual T25 flasks in DMEM supplemented with 10% of each respective serum. Cells were passaged twice a week. Morphology, cell growth, PDT, and viability were observed for each passage. Viability and PDTs for each individual sample, average per lot, and average per country were monitored for 19 passages over 62 days.
Transfection of adherent HEK293T cells
Cells were co-transfected with three AAV2 plasmids (Cell Biolabs) using PEIpro™ (Polyplus-transfection). Cells were passaged into 6-well plates the day before transfection. On the day of transfection, a master mix of plasmids and PEIpro was prepared and then aliquoted to each experimental condition. Cells were thereafter monitored for GFP fluorescence using a fluorescence microscope 24 and 48 h post-transfection. Cells were harvested 72 h post-transfection for counting, fluorescence activated cell sorting (FACS) analysis for transfection efficiency, and virus titrations.
Adherent HEK293T cells were harvested by intensive pipetting of each well. A 50 µL aliquot was fixed in 50 µL 4% phosphate-buffered formaldehyde. A ~ 550 µL sample was used for counting cells, and the remaining cell suspension was saved for virus titrations. Harvested cell suspension samples were freeze-thawed at -80°C three times to lyse all cells before the supernatant was clarified using centrifugation.
AAV2 ELISA
ELISA titrations were done using a commercial AAV2 ELISA kit (Progen) according to the manufacturer’s instructions. All samples were tested in duplicates.AAV2 qPCR
qPCR titrations for AAV2 titers were done using an in-house developed protocol and primers. All samples were tested in duplicates.
AAV2 transduction assay
An in-house transduction assay and adherent HEK293T cells were used to measure infectious virus titers. Clarified supernatants from 3× freeze/thawed cell cultures were diluted 1:1000 in DMEM with 10% FBS before analysis using the transduction assay. Virus titers were calculated using the average number of cells/well at the time of transfection, the fraction of GFP-positive live cells at harvest, the dilution factor of each sample, and the transduction volume (here
500 µL), according to the formula:
Transduction volume
Statistical analyses
All data was presented as mean with standard deviations (where applicable). Statistical analyses to investigate differences between FBS originating from different countries were done using single-factor ANOVA analyses with Bonferroni corrections. The accuracy of the ELISA, qPCR, and transduction assay methods were also taken into account to judge the significance of any observed trends.
TR #29621157