Introduction
Developing and optimizing a new fed-batch process for mAb production does not have to be complicated. By learning some key things about your cell line from the start – the nutrients it needs over the culture time, impact of metabolites, and critical osmolality – you can quickly design a daily feeding regimen that is simple to perform at production scale.
Illustrating this approach, we developed a high-performing fed-batch process for a CHO-K1 GS-knockout cell line (GS -/-) expressing IgG1. Cells were grown in HyClone™ brand ActiPro™ medium and fed with HyClone™ brand Cell Boost™ 7a and 7b. The optimized feed regimens were defined in shake flasks (SF), and then scaled up to bioreactor (BR) experiments. The outcome? The peak titer values were 5-fold higher than when cells were grown in ActiPro™ alone (Fig 1).
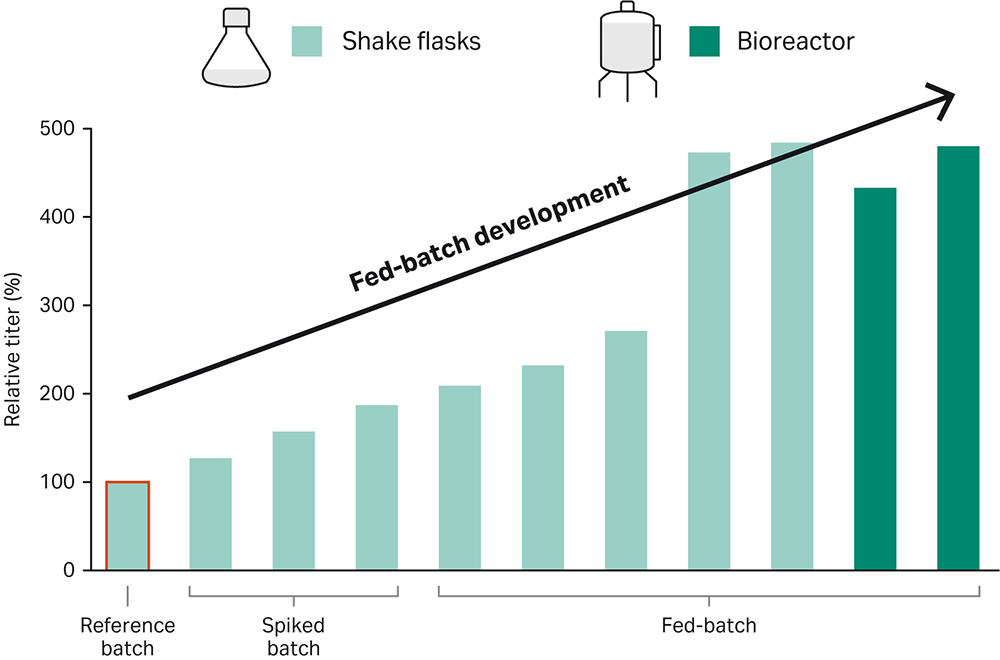
Fig 1. Fast and lean workflow developed for a highly efficient fed-batch bioreactor process. The cell line of interest was grown in ActiPro™ medium supplemented with Cell Boost™ 7a/b.
Our goal was to develop a process to overcome critical bottlenecks in the workflow that lead to arrested productivity and cell growth. Optimizing the feeding regimens would provide a proper daily supply of nutrients while keeping toxic byproducts, including lactate or ammonia, low and thus keeping osmolality low.
One way to develop a process is using a complex feeding regimen that is based on continuous or dynamic feed addition, including calculations for nutrient consumption rates or increase in cell density. Instead, we chose a simple strategy where feeds were added as a daily bolus. Indeed, previous experiments showed that more complex feeding regimens do not always lead to higher harvest titers (1). We used the KISS (‘keep it simple stupid’) principle to develop a robust fed-batch process that is easy to perform (2).
We developed our strategies based on a simple, three-step approach. First, we used shake flasks to check the impact of an initial spike of three different Cell Boost™ 7a/7b concentrations. We also determined the nutrient limitations and critical osmolality. Next, we optimized the feeding strategy in shake flasks by evaluating six regimens where feeds were added as a daily bolus. Last, we extended those learnings to a 500 mL bioreactor by performing two runs.
All analytics were done offline. These included viable cell densities (VCD), viability, glucose, lactate, L-glutamate, L-glutamine, ammonia, osmolality, and antibody titers. See the bottom of the page for detailed Materials and methods.
Results and discussion
Step 1: Evaluate effect of feed spike and determine critical osmolality
To develop a fed-batch process for a new CHO cell line, we recommend first testing the positive effects of Cell Boost™ 7a and Cell Boost™ 7b added to ActiPro™ basal medium. This is done by testing different initial (day zero) spike concentrations in simple batch cultivations. In this way you can check the impact of nutrient limitation or improved nutrient supply, and you can estimate the impact of elevated culture osmolality. Because you will have a detailed analysis of consumed nutrients and metabolic byproducts, you can also check the benefits of the supplements.
As a starting point, we spiked Cell Boost™ 7a/b (10:1 ratio of a:b) at 1.1%, 3.3%, and 5.5% on day 0. We compared the results to the ActiPro™ control culture (Fig 2).
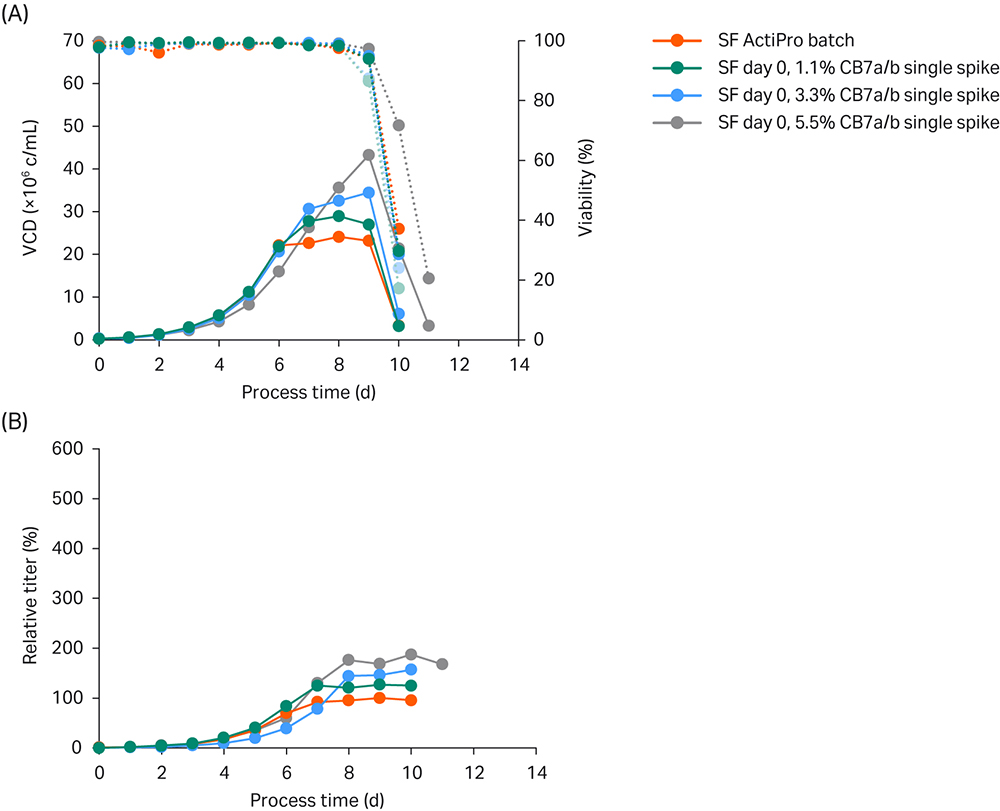
Fig 2. Simple ActiPro™ batch experiments in shake flasks (SF) to assess the impact of different Cell Boost 7a/b (CB7a/b) concentrations spiked at day 0. (A) Viable cell density (VCD) and viability; (B) Titer values relative to the peak titer of the ActiPro™ control culture.
The ActiPro™ control and cultures spiked with CB7a/b at 1.1% or 3.3% grew to similar VCD of 20 million viable cells (MVC)/mL until day 6, even though their starting osmolalities were different. CB7a/b spiked at 5.5% showed decreased VCD and lower specific growth until day 6, which indicated a negative effect of higher osmolality. After day 6, the ActiPro™ control showed a much slower growth rate due to nutrient limitation. Interestingly, the decrease in specific growth and productivity correlated with the availability of residual nutrients.
Spiking with 5.5% CB7a/b increased the starting concentrations of glucose and glutamate (data not shown). As a result, residual nutrients present on day 6 supported higher growth after day 7. This led to a gradual increase in final peak VCD up to 43 MVC/mL on day 9 and peak titers up to 187% of the control level.
In summary, cultures spiked with Cell Boost™ 7a/7b maintained higher specific growth rates and productivities at late culture times. This, combined with high VCD, is responsible for accumulating extensive amounts of mAb protein. Spiking with 5.5% CB7a/b resulted in reduced initial growth but higher final peak VCD values with slightly higher specific productivities until day 6, and significantly higher cell-specific productivity (qP) thereafter. The enhanced qP in the early growth stage compared to the basal ActiPro™ culture can be attributed to enhanced osmolality, which is often reported in literature (3). In contrast, at later process stages enhanced growth and productivity can be attributed to maintained nutrient supply.
Spiked-batch experiments were used to estimate the effect on cell growth and productivity by a single initial bolus spike and to identify critical nutrient limitations that must be prevented in high-performing fed-batch cultures. Specifically, for this cell line, a decreased specific growth was observed at higher osmolalities. Also, glutamate was identified as one critical key nutrient that should be adequately controlled in future fed-batch applications.
Step 2: Optimize feeding strategy
Recent experiments showed that feeding with Cell Boost™ 7a and 7b according to more complex feeding regimes did not provide substantial benefit compared to simple bolus feeding based on fixed daily volumes (1). The latter strategies are easy to design, calculate, and perform. However, possible critical bottlenecks must be identified, including nutrient limitations, enhanced lactate and ammonia concentrations, or critical osmolalities. And the process control (i.e., feed and base addition or CO2 stripping) must be adjusted accordingly.
To define optimal feeding regimens, small-scale fed-batch experiments were performed in shake flasks to test different feeding strategies based on fixed daily bolus volumes. Basal ActiPro™ batch cultures were performed as a control.
Spike experiments
The first strategy spiked 3.3% CB7a/b at day 0. The second strategy spiked 3.3% CB7a/b twice – once at day 0 and again at day 4. The results are shown in Figure 3.
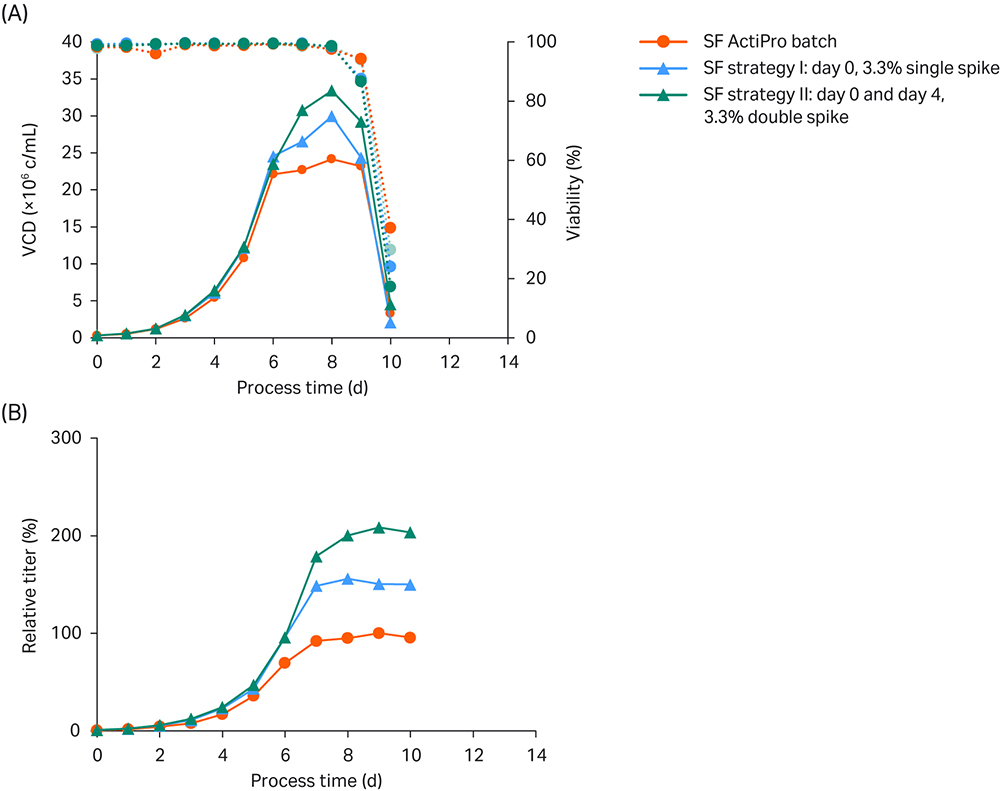
Fig 3. Shake flask (SF) batch experiments to investigate the influence of different CB7a/b spike concentrations. (A) VCD and viability; (B) Titer values relative to the peak titer of the ActiPro™ control culture.
Peak VCD of 24 MVC/mL was reached in batch cultivation of basal ActiPro™ with a total process time of 10 days. Specific cell growth drastically declined after day six, because critical nutrients including glutamate were depleted. On the same day, glucose was becoming limiting and cells switched to lactate consumption. No further increase of the final peak titer was observed after day seven, and thus this value was used as the 100% peak titer reference.
Using a single initial 3.3% Cell Boost™ spike (strategy I) delayed the glutamate limitation for one additional day resulting in enhanced VCD and an increase in peak titer to 156%. Substantial consumption of the provided glutamate and synthetized glutamine was observed on day 4 together with a decrease in osmolality. Thus, a second 3.3% Cell Boost™ spike was tested on day 4 in strategy II. This delayed the glutamate/glutamine limitation by one additional day at acceptable low osmolalities. Peak VCD values were boosted up to 33 MVC/mL, and final peak titers doubled compared to the batch cultures. But the final process time was still 10 days.
Fed-batch experiments
As a next step daily bolus feeding was evaluated in four strategies – III, IV, V, and VI – as described in Table 1.
Table 1. Feeding strategies tested in shake flask experiments
| Strategy |
Cell Boost™ 7a/b concentration |
Timing of feed addition |
| Basal ActiPro™ –Batch | 0% | NA |
| I – Spike | 3.3% | Day 0 |
| II – Double spike | 3.3% | Day 0 and Day 4 |
| III – Fed batch | 1.1% | Daily starting on day 3 |
| IV – Fed batch | 2.2% | Daily starting on day 3 |
| V – Fed batch | 1.1%/3.3% | Daily 1.1% starting on day 0; daily 3.3% starting on day 7 |
| VI – Fed batch | 3.3% | Daily starting on day 3 but only if osmolality < 380 mOsm/kg |
Results are shown in Figure 4.
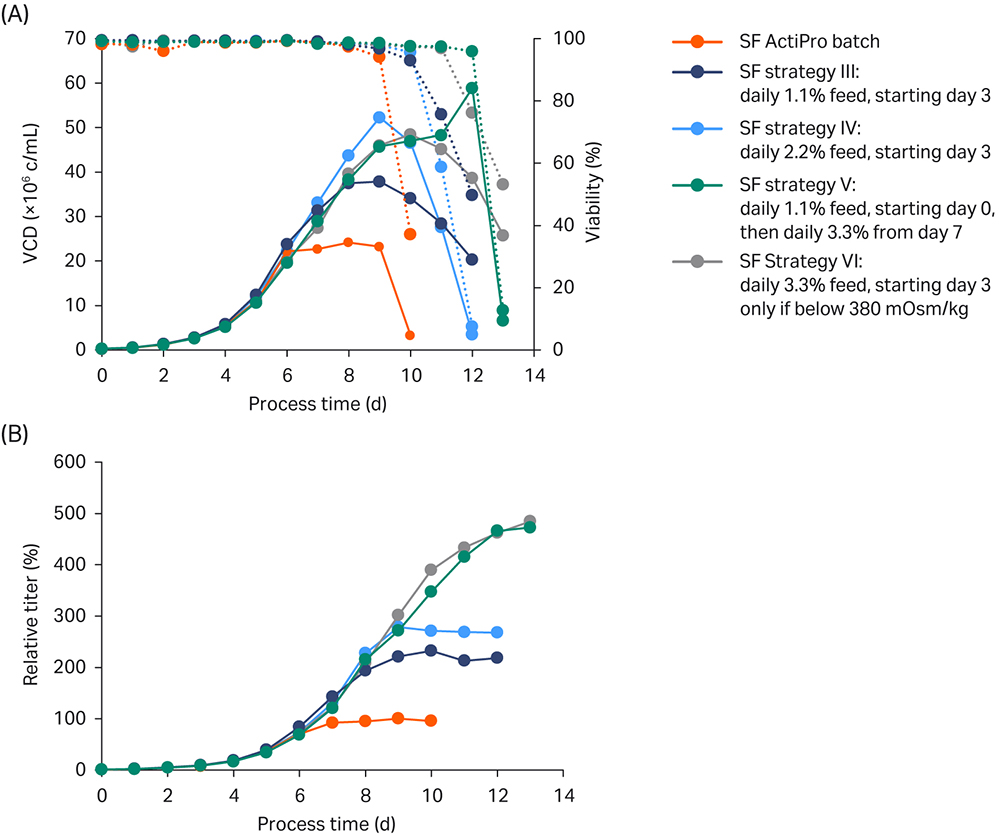
Fig 4. Shake flask (SF) batch experiments to investigate the influence of different CB7a/b spike concentrations. Each fed-batch culture was run as duplicate (n= 2). (A) VCD and viability; (B) Titer values relative to the peak titer of the ActiPro™ control culture.
In strategy III, daily feeding of 1.1% CB7a/b starting from day 3 maintained relatively low osmolalities despite extensive lactate accumulation up to 3.5 g/L. In a bioreactor setup, low osmolalities would allow room to add base in order to adjust the decrease in pH. However, the daily feed addition did not maintain critical glutamate/glutamine levels after day 6, resulting in growth arrest on day 8 at 40 MVC/mL and final relative peak titers of 232%. Also, because glucose stock was added, no lactate shift was observed.
In strategy IV, increasing the daily feed addition to 2.2% from day 3 onwards resulted in enhanced osmolality with a first peak at 350 mOsm/kg on day 6. After that, glutamate was rapidly consumed resulting in a critical limit on day 8; growth and productivity stopped after one additional day. Until day 8, this culture showed promising results highlighted by the highest VCD and low osmolalities, which left room to add feed or base.
The best overall performance was obtained with daily feeding at 3.3% starting on day 3 (strategy VI) or 1.1% starting on day 0 and adjusting the feed addition based on the cellular needs (strategy V). In strategy VI the feed was stopped when osmolalities reached critical levels above 380 mOsm/kg; in strategy V the feed was increased to 3.3% when glutamate and glutamine were rapidly consumed, as indicated by a drastic decrease in osmolality. Interestingly, both cultures received similar final feed amounts. Compared to the other cultures, relatively high feed volumes were added after day 3, resulting in higher glucose, glutamate, and peak glutamine levels and therefore also higher osmolalities. Both strategies V and VI resulted in nearly 5-fold increased titers compared to ActiPro™ batch cultures. But because strategy VI was simpler with feeding starting at day 8, we chose that one for bioreactor verification.
Results of all six strategies compared with the basal ActiPro™ culture are listed in Table 2.
Table 2. Feeding strategies tested in shake flask experiments
| Strategy |
Cell Boost™ 7a/b concentration (%) |
Timing of feed addition |
Cumulative feed amounts (%) |
Cumulative 250 g/L glucose stock addition (%) |
Relative integral of VCD |
Relative peak titer |
| Basal ActiPro™ –Batch | 0 | 0 | 0 | 100% | 100% | |
| I – Spike | 3.3 | Day 0 | 3.3 | 0 | 113% | 156% |
| II – Double spike | 3.3 | Day 0 and Day 4 | 7 | 0 | 128% | 209% |
| III – Fed-batch | 1.1 | Daily starting on day 3 | 9 | 3.8 | 259% | 232% |
| IV – Fed-batch | 2.2 | Daily starting on day 3 | 15 | 3.2 | 297% | 279% |
| V – Fed-batch | 1.1/3.3 | Daily 1.1% starting on day 0; daily 3.3% starting on day 7 | 21 | 4.9 | 369% | 473% |
| VI – Fed-batch | 3.3 | Daily starting on day 3 but only if osmolality < 380 mOsm/kg | 23 | 3.5 | 371% | 484% |
Step 3: Verify and adjust in bioreactor
Once the optimal feed regimen and possible feeding bottlenecks were identified, the process could be transferred to a bioreactor verification run. Small-scale shaking experiments are highly suitable for high-throughput optimization of many different conditions. However, in the final bioreactor run the performance can deviate from the shaking experiments. One main reason is the controlled pH and dissolved oxygen in the bioreactor. The former parameter is modified by different levels of CO2 gassing or addition of base solution, whereas the latter is modified by varying oxygen concentration, gas flow rate, stirrer speed, and sparger design. All these process variables may profoundly affect the cell performance. For example, it is widely accepted and shown in literature that an acidic environment reduces specific growth (4). Thus, the feeding regimen in the bioreactor must be modified according to the cellular needs, starting from the established feeding strategy defined in the small-scale shaker experiments.
Two similar bioreactor strategies (BR I and BR II) were tested in parallel and were fed according to the best shaker strategy VI for the first four culture days.
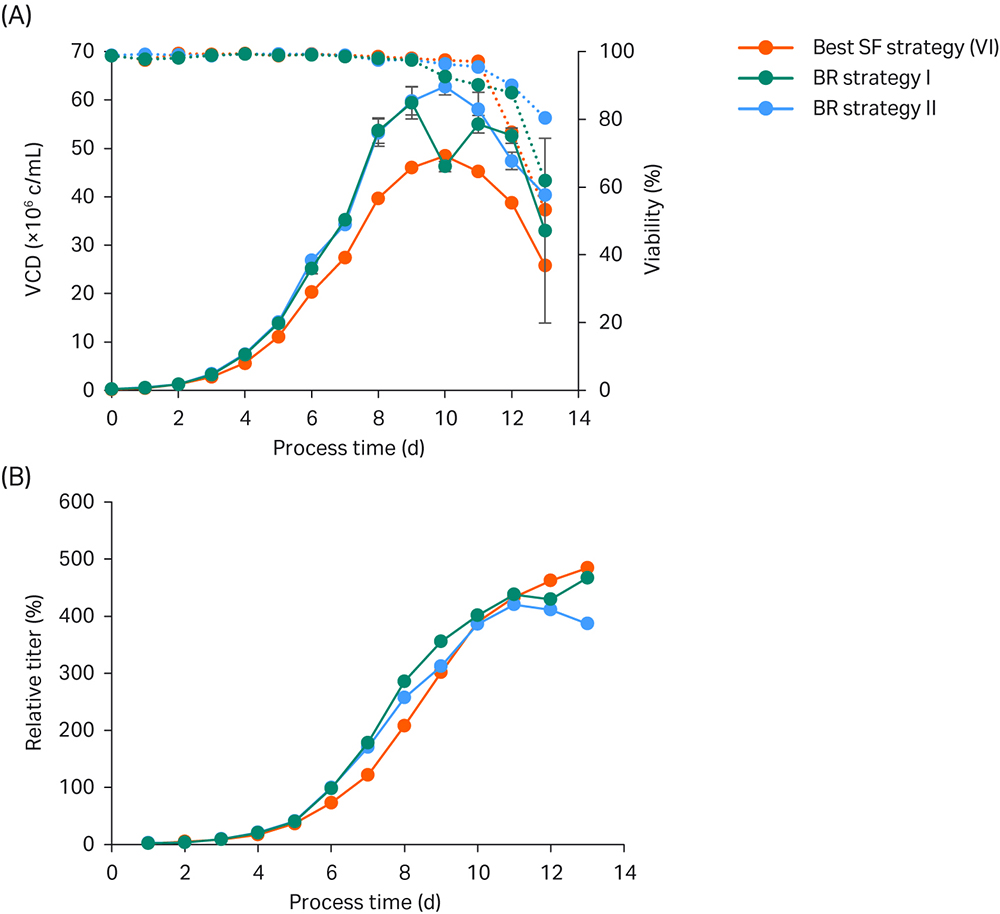
Fig 5. Bioreactor verification run. (A) VCD and viability; (B) Titer values relative to the peak titer of the basal ActiPro™ batch culture. Bioreactor cultures were run in duplicate.
In this example a bioreactor pH setpoint of 6.9 was chosen as a reasonable compromise between optimal growth but minimal base addition. High initial growth rates were observed in the first two days of the shake-flask (SF) culture. On day 3, VCD in the SF reached 2.8 MVC/mL (Fig 5), and the pH dropped significantly as lactate accumulated in the culture up to 1.7 g/L (data not shown). In the bioreactor, the pH is controlled at constant pH 6.9 by stopping CO2 addition on day 3 followed by base addition (Table 3).
Table 3. Process control overview for a 500 mL DASGIP bioreactor (BR I) culture*
|
CB7a/b (% w.v.) |
Gluc stock (g/L) |
Total Gluc (g/L) (CB7a/b + stock) |
RPM/flow (L/h) |
pH.SP/XCO2 (%)/cum. base (mL) |
Comments |
|
| Day 0 | 0% | +0 | +0 | 80/3 | 6.9/15/0 | 3 critical parameters: i) nutrient ii) DO iii) pH |
| Day 1 | 0% | +0 | +0 | 80/3 | 6.9/13/0 | |
| Day 2 | 0% | +0 | +0 | 80/3 | 6.9/10/0 | |
| Day 3 | 3.3% | +0 | +2 | 80/3 | 6.9/3/0 | |
| Day 4 | 3.3% | +0 | +2 | 80/3 | 6.9/3/9 | |
| Day 5 | 3.3% | +0 | +2 | 80/3 | 6.9/3/18 | |
| Day 6 | 3.3% | +2 | +4 | 100/9 | 6.9/0/20 | |
| Day 7 | 6.6% | +2 | +6 | 150/18 | 6.9/0/27 | SF: critical osm BR: Glu/Gln and NH4+ (!) low |
| Day 8 | 6.6% | +0 | +4 | 180/20 | 6.9/7/27 | SF: gluc limit, lac consumed |
| Day 9 | 3.3% | +0 | +2 | 180/20 | 6.9/15/27 | BR: osm critical, Glu/Gln increased |
| Day 10 | 0.0% | +3 | +3 | 180/20 | 7.0/18/27 | BR: critical Osm, no feed needed, Gluc/Lac limit (only Gluc), pH.SP 7.0 |
| Day 11 | 0.0% | +2 | +2 | 120/9 | 7.0/30/27 | BR: no feed needed (Glu/Gln), only Gluc |
| Day 12 | 0.0% | +2 | +2 | 120/9 | 7.0/30/27 |
* Addition of Cell Boost 7a and 7b (CB7a/b) is expressed as percentage of the actual working volume (% w.v.). The final enhancement of the glucose concentration is given in g/L and includes the contribution from the CB7a/b addition or from a separate addition of 250 g/L glucose stock solution. Additional critical bioreactor parameters are also shown including stirrer speed (rpm), gas flow (L/h), pH setpoint (pH.SP), CO2 concentration in the inlet gas (XCO2), and cumulative base volume (mL).
As a result of higher culture pH, the bioreactor cultures showed higher specific growth on days 4 and 5 resulting in higher glucose consumption. Lactate levels reached critical levels of up to 3.9 g/L. Therefore, we decided to test a rescue strategy (BR II) in parallel on day 5 to keep lactate accumulation, base addition, and final osmolality at low levels. One duplicate culture (BR I) was fed according to the best shaker strategy (VI) whereas in the backup culture feed addition was stopped on day 5 resulting in a drastic decrease in culture glutamate, glutamine, and ammonia levels one day thereafter (data not shown). Furthermore, the lactate shift was induced because of limiting glucose levels, which resulted in reduced base addition and drastically lowered osmolalities in the rescue strategy (BR II) compared to BR I.
Feeding of culture BR I was continued with 3.3% CB7a/b on day 5. Because CB7a contains around 70 g/L of glucose, which adds 2 g/L glucose from the feed solution (Table 3). On day 6 the measured glucose in the culture was decreased by 1.9 g/L, which calculates to a glucose consumption of 3.9 g/L from day 5 to day 6. As a consequence, on day 6 glucose at 2 g/L was added by CB7a/b addition, and 2 g/L more was added by a glucose stock solution to limit lactate accumulation but maintain high viabilities and growth rates (Table 3).
Already on day 6, the osmolalities of both BR strategies were lower compared to SF VI as a result of lower glucose, glutamate, glutamine, and ammonia levels. This beneficial condition gives more room to add feed and base. Because of extensive ammonia consumption used for endogenous glutamine synthesis, the ammonia reached critically low levels on day 6 for BR II or day 7 for BR I. Thus, we decided to increase the daily feed addition to 6.6% on day 7 and 8 in BR I to prevent any limitation in glutamate and ammonia levels.
On day 9, both BR duplicate cultures surpassed the critical 400 mOsm/kg threshold and showed decreased specific growth. Furthermore, glutamate concentrations stayed stable and glutamine accumulated in the medium. Thus, we decided to decrease the feed volume to 3.3% CB7a/b. On day 10, viabilities decreased slightly and a drastic increase in ammonia levels was observed, which is indicative for late-stage fed-batch cultures. Because the measured glutamate levels continued to increase, we decided to stop the daily CB7a/b addition and only feed with glucose for the last few culture days at already critical osmolalities.
Using the optimized bioreactor fed-batch setup as summarized in Table 3, cultures reached exceptionally high VCD values of up to 60 MVC/mL and similar peak titers compared to the best small-scale shake flask experiment. These results represent a 5-fold improvement compared to the basal ActiPro™ batch experiment.
Conclusion
Here we describe a straightforward way to achieve high-performing fed-batch process. The workflow, which consisted of initial spike batch experiments, followed by fed-batch optimization in shake flasks, and final bioreactor optimization, yielded an optimized fed-batch process for the recombinant CHO-K1 GS -/- cell line expressing IgG1. The titer was 500% higher than the titer in a simple ActiPro™ batch culture (Figure 6). Importantly, a correlation (Pearson correlation r= 0.9) between increased titer and cumulative integral of viable cell density (IVCD) was found. This emphasizes that high viable cell densities were required for improving harvest titer significantly.
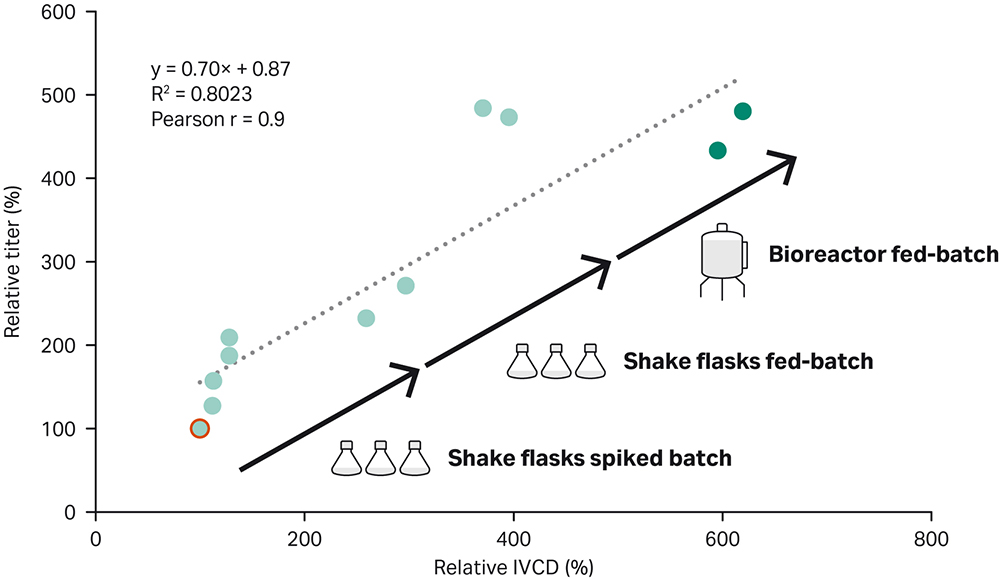
Fig 6. Improvement of harvest titer together with the cumulative integral of viable cell density (IVCD) using the demonstrated fed-batch development workflow. A Pearson correlation coefficient of r=0.9 was found for titer versus IVCD values.
Initial batch testing highlighted glutamate as the most important critical nutrient that limited cell growth when depleted. Furthermore, decreased growth rates were observed at high osmolalities. These findings suggest the need for more sophisticated feeding regimens to keep osmolalities low but maintain critical glutamate levels. Simple feed regimens based on the KISS principle allow high-throughput fed-batch screening in small-scale shaking flask cultures. Such strategies are based on simple daily bolus feed volumes and resulted in significantly increased harvest titers and final IVCD when optimized. Cells in the bioreactor may behave differently compared to shaking flask cultures, mainly because dissolved oxygen and pH values are controlled inside the bioreactor at defined setpoints.
With the chosen starting pH setpoint of 6.9, we observed an increased initial growth rate in the bioreactor accompanied by increased glucose uptake and lactate secretion. As a consequence, the feed strategy optimized in shaking flask was adjusted by stopping the feed addition or increasing the feed volume at define time points in order to provide enough nutrients (glutamate) to the cells but keep toxic by-products including lactate at minimal levels. The latter point also minimized base addition and kept osmolalities at lower concentrations, which leaves room to add more feed.
Download our media selection brochureAcknowledgements
We thank Horizon Discovery for permission to use their data and for insightful discussions.
- Application note: Optimization of fed‑batch culture conditions for a mAb‑producing CHO cell line. Cytiva, CY15106-10Jul20-AN. 2020.
- Lu F, Toh PC, Burnett I, et al. Automated dynamic fed-batch process and media optimization for high productivity cell culture process development. Biotechnol. Bioeng. 2013;110:191-205. doi: 10.1002/bit.24602
- Hoshan L, Jiang R, Moroney J, et al. Effective bioreactor pH control using only sparging gases. Biotechnol. Prog. 2019;35:e2743. doi: 10.1002/btpr.2743
- Brunner M, Fricke J, Kroll P, and Herwig C. Investigation of the interactions of critical scale-up parameters (pH, pO2 and pCO2) on CHO batch performance and critical quality attributes. Bioprocess. Biosyst. Eng. 2017;40:251-263. doi: 10.1007/s00449-016-1693-7.
Routine cultivation
A recombinant CHO-K1 GS -/- cell line expressing an IgG1 antibody (HD BioT-016, Horizon Discovery, UK) was routinely cultured in HyClone™ brand ActiPro™ medium (Cytiva) without any supplements. Cells were passaged twice a week at 0.3 MVC/mL to keep them in exponential growth phase. A 30 mL cell suspension was cultured in a 125 mL shake flask in a Kuhner incubator at 140 rpm with an orbital shaking diameter of 25 mm. Temperature was 37°C and humid atmosphere had 7% CO2.
Feed addition
HyClone™ brand Cell Boost™ 7a and 7b (Cytiva) were added separately to the cultures as bolus feed on each feeding day. Importantly, HyClone™ brand Cell Boost™ (CB) 7b was always added as 1/10 of the volume of Cell Boost™ (CB) 7a by default throughout this study, as recommended by the manufacturer. As an example, a 1.1% CB7a/b feed addition means that 10 mL of cell suspension received 100 µL of Cell Boost™ 7a and 10 µL of Cell Boost™ 7b.
Batch experiments in shake flasks (SF)
Cells from routine cultivation were passaged into prewarmed HyClone ActiPro medium at 0.3 MVC/mL in a final starting volume of 35 mL in a 125 mL shaker flask. Cultures were spiked with 0.0%, 1.1%, 3.3% or 5.5% of Cell Boost 7a and 7b on day 0 and incubated in the Kuhner shaker incubator at 140 rpm at 25 mm orbital shaking diameter, 37°C, and humid atmosphere with 7% CO2.
Fed-batch experiments in shake flasks (SF)
Cells from routine cultivation were passaged into prewarmed HyClone™ brand ActiPro™ medium at 0.3 MVC/mL in a final starting volume of 60 mL in a 250 mL shaker flask. Cultures were fed with Cell Boost™ 7a and 7b once daily by a simple bolus feed volume, according to the tested feeding regimens, and incubated in a Kuhner shaker incubator at 140 rpm at 25 mm orbital shaking diameter, 37°C and humid atmosphere with 7% CO2. For the fed-batch experiments in shake flask (SF) the glucose level was controlled by addition of a 250 g/L glucose stock solution to 6 g/L once cultures reached a minimum glucose concentration of 3 g/L.
Fed-batch bioreactor experiments in bioreactors (BR)
Cultures were seeded at 0.3 MVC/mL into HyClone™ brand ActiPro™ medium in a final starting volume of 500 mL. Cultivation was started in a DASGIP bioreactor system at 37°C with a minimum stirrer speed of 80 rpm and a constant pH setpoint of 6.9. Dissolved oxygen (DO) was kept constant at 30% using an automated cascade for variable flow rate and oxygen concentration in the inlet gas flow or by manual adjustment of the stirrer speed. The pH of the culture was regulated at pH 6.9 by CO2 or 4% sodium bicarbonate solution, and foaming was prevented by manual dropwise addition of a diluted (1:100) Antifoam C solution. The pH setpoint was changed to pH 7.0 on day 10 of the fermentation to prevent excessive CO2 addition for the last three process days.
Offline analytics
Viable cell densities (VCD) and viability was measured with a ViCell instrument using trypan blue dye exclusion. Glucose, lactate, L-glutamate, L-glutamine, and ammonia were measured with a Bioprofile™ 100 plus instrument. The osmolality was measured with an Osmomat 030 instrument. Antibody titers were measured with an Octet Red instrument.