The most efficient chromatography platforms currently available for scaled-down high-throughput process development (HTPD) exist in a 96-well plate format (e.g., PreDictor plates from Cytiva). These can be invaluable for automated early screening work, enabling a large array of conditions to be scouted with reduced material and time costs (1). However, the requirement for specialized liquid handling equipment and robust bridging experiments to translate to process scale can be considered a disadvantage.
Fiber-based Fibro chromatography offers an alternative. Here, results from two high-throughput units are presented—research-scale and 96-well. The units are based on established protein A and ion exchange ligands that are immobilized onto cellulose fiber adsorbent mounted in polypropylene housing, called Fibro units in these studies (2).
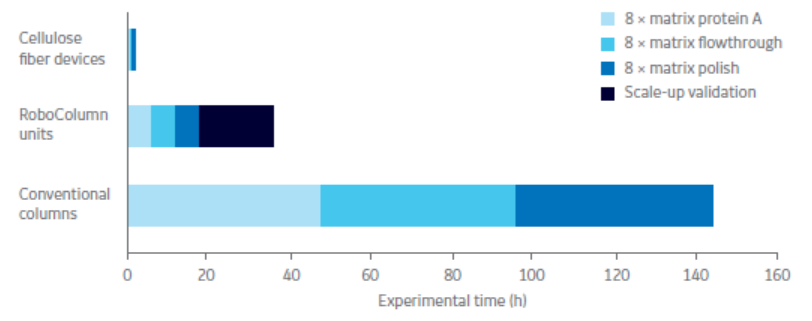
We evaluated research-scale protein A functionalized Fibro chromatography units capable of purifying ~ 10 mg of monoclonal antibody in a primary capture mode in a 2 min chromatography cycle, with capacity independent of flow rate (Fig 1). Figure 2 displays how operating at high flow rates and in smaller scales allows full process development to be carried out quickly, with sufficient material generated to perform material characterization studies.
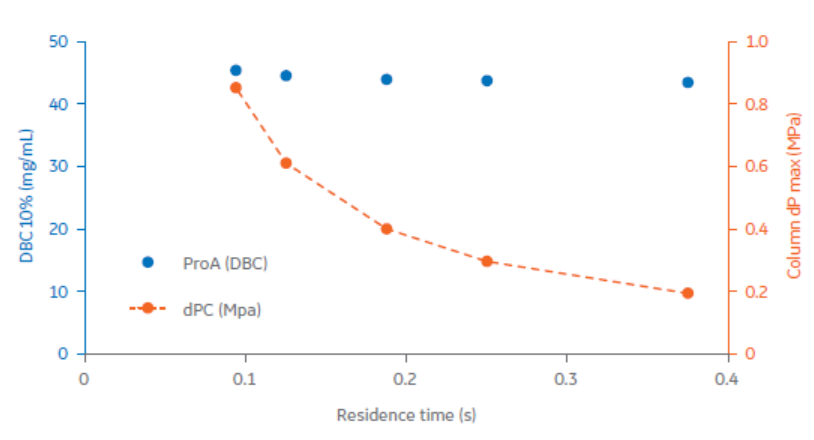
The Fibro adsorbent material is designed to operate in a rapid cycling mode, with each unit capable of being cycled > 100 times in a single working shift. The units are being developed to handle mAb quantities for large industrial processes.
Two case studies are presented here to demonstrate the complementary attributes of the two formats: 0.4 mL laboratory-scale and 60 μL 96-well plate. The first case study covers the process development of a primary capture step on an industrially relevant mAb, varying process conditions such as pH, concentration of elution and post-load wash buffers, and flow rate. The second case study illustrates the integration of the capture step into upstream development by using the robust cellulose fiber matrix to handle centrifuged material from ambr™ 15 bioreactors to obtain samples for analysis during a cell line selection screen.
Case study 1. High-throughput buffer screening for a protein A chromatography step
An initial set of design of experiments (DoE) studies, examining which factors have the most influence upon the elution profile including buffer strength, pH, and flow rate during elution, determined that concentration of elution buffer had the most significant effect. A full investigation of effect of buffer strength on elution profile, including interaction with post-load wash buffers, was carried out with a monoclonal antibody (mAb 1) supplied by GlaxoSmithKline (GSK), Gunnels Wood Road, Stevenage, Herts, SG1 2NY UK.
Materials
- ÄKTA avant 150, using UNICORN 7.0 (Cytiva)
- Fibro adsorbent material functionalized with protein A, 0.4 mL matrix volume
- Binding buffer: 20 mM Tris, pH 7.5 + 150 mM NaCl
- Post-load wash buffer (Table 1)
- Elution buffer (Table 1)
- mAb 1, post-protein A purified monoclonal antibody, made up to 1 g/L in binding buffer
Method
Chromatography runs were performed on ÄKTA avant 150 at a flow rate of 15 mL/min, 37.5 matrix volumes (MV)/min, 1.6 s residence time (for equilibration, loading, post-load washing, and elution on a 0.4 mL matrix), with each full cycle taking 2 min. Buffers for post-load wash and elution were varied as shown in Table 1, using two matrix volumes of each buffer.
Table 1. Post-load wash (PLW) and elution buffers used in the study
| PLW buffer | Elution buffer |
|---|---|
| 1 20 mM Tris 150 mM, NaCl pH 7.5 | A 30 mM NaOAc, pH 3.5 |
| 2 10 mM Tris, pH 7.5 | B 50 mM NaOAc, pH 3.5 |
| 3 20 mM Tris, pH 7.5 | C 100 mM NaOAc, pH 3.5 |
| 4 50 mM Tris, pH 7.5 | D 150 mM NaOAc, pH 3.5 |
| 5 50 mM citrate, pH 5.5 | E 30 mM acetic acid, pH 3.2 |
| 6 100 mM citrate, pH 5.5 | F 50 mM acetic acid, pH 3.1 |
| 7 50 mM NaOAc, pH 5.0 | G 100 mM acetic acid, pH 2.8 |
| 8 100 mM NaOAc, pH 5.0 | H 150 mM acetic acid, pH 2.7 |
The load for each run was 4 mL of mAb 1 at 1 g/L, with each combination of wash and elution buffers run in duplicate. Results were reported from the integration of the chromatograms using the automated integration feature of the UNICORN 7.0 software, with peak area (mAU/mL) values comparing recovery.
Results
Results are reported in Tables 2 and 3. Percent recovery is defined by the area of the elution peak, and the peak width in column volumes gives us the pool volume of the eluate. The speed of the pH transition is determined by the relative buffer strength of the wash and elution buffers, with the fastest transitions giving the sharpest peaks. The strongest buffers give the smallest peak width for elution. However, when considering post-protein A process steps, for example, post-viral hold, cation exchange (CEX), and anion exchange (AEX) chromatography, it is worth noting that the higher buffer strength eluent pool will require a greater volume of titration buffer to raise the pH, thus resulting in a lower overall eluent pool concentration. The data also appears to show that acetic acid is a less favorable elution buffer, especially at lower concentrations, because the recovery is significantly lower, indicating that the required pH for optimal elution is not reached.
The low-pH intermediate wash steps speed up pH transition as expected, but in the case of the higher molarity buffers, it appears that the wash is starting to elute material, adversely affecting recovery.The most favorable combination for mAb 1 appears to be 50 mM sodium acetate at pH 5.5 for wash, with a 100 mM sodium acetate elution buffer at pH 3.5. These conditions gave a recovery of 89%, with a peak width of 3.8 column volumes (CV). Duplicate runs of the 64 experimental conditions were completed in 4.5 h, demonstrating the power of this tool for HTPD. These results also highlight key conditions for further process development optimization with the Fibro adsorbent PD units being developed for scalable industrial performance.
Table 2. Elution peak width for mAb 1 (128 runs performed in < 1 day on an ÄKTA avant system)
| Peak width (CV) | 20 mM Tris 150 mM NaCl pH 7.5 | 10 mM Tris pH 7.5 | 20 mM Tris pH 7.5 | 50 mM Tris pH 7.5 | 50 mM citrate pH 5.5 | 100 mM citrate pH 5.5 | 50 mM NaOAc pH 5.0 | 100 mM NaOAc pH 5.0 | |
| 1 | 2 | 3 | 4 | 5 | 6 | 7 | 8 | ||
| 30 mM NaOAc pH 3.5 | A | 6.6 | 4.1 | 6.5 | 6.5 | 3.6 | 3.1 | 4.2 | 3.3 |
| 50 mM NaOAc pH 3.5 | B | 5.9 | 4.9 | 6.4 | 6.4 | 3.8 | 3.8 | 3.7 | 6.3 |
| 100 mM NaOAc pH 3.5 | C | 5.5 | 4.4 | 5.0 | 5.0 | 3.8 | 3.7 | 3.8 | 3.8 |
| 150 mM NaOAc pH 3.5 | D | 4.5 | 4.3 | 3.7 | 3.7 | 3.8 | 3.7 | 3.8 | 3.8 |
| 30 mM acetic acid pH 3.2 | E | - | 3.0 | 2.9 | 4.1 | 2.4 | 2.8 | 2.2 | 1.8 |
| 50 mM acetic acid pH 3.1 | F | - | 4.0 | 3.7 | 3.5 | 3.8 | 2.9 | 2.9 | 2.9 |
| 100 mM acetic acid pH 2.8 | G | 5.5 | 5.1 | 4.9 | 5.0 | 5.1 | 4.5 | 4.9 | 4.3 |
| 150 mM acetic acid pH 2.7 | H | 5.9 | 5.3 | 5.2 | 5.2 | 5.7 | 5.2 | 5.5 | 5.1 |
Table 3. Percent recovery for mAb 1 (128 runs performed in < 1 day on an ÄKTA avant system)
| Recovery | 20 mM Tris 150 mM NaCl pH 7.5 | 10 mM Tris pH 7.5 | 20 mM Tris pH 7.5 | 50 mM pH 7.5 | 50 mM citrate pH 5.5 | 100 mM citrate pH 5.5 | 50 mM NaOAc pH 5.0 | 100 mM NaOAc pH 5.0 | |
| 1 | 2 | 3 | 4 | 5 | 6 | 7 | 8 | ||
| 30 mM NaOAc pH 3.5 | A | 71.2 | 68.1 | 59.4 | 55.4 | 57.4 | 45.0 | 67.9 | 44.7 |
| 50 mM NaOAc pH 3.5 | B | 85.0 | 97.0 | 92.6 | 100.0 | 77.9 | 72.7 | 80.4 | 82.2 |
| 100 mM NaOAc pH 3.5 | C | 89.1 | 97.8 | 95.6 | 91.3 | 86.1 | 85.6 | 89.0 | 81.5 |
| 150 mM NaOAc pH 3.5 | D | 89.1 | 96.5 | 96.6 | 89.2 | 85.8 | 87.9 | 89.3 | 80.4 |
| 30 mM acetic acid pH 3.2 | E | - | 46.6 | 54.4 | 76.9 | 33.6 | 51.6 | 27.8 | 27.4 |
| 50 mM acetic acid pH 3.1 | F | - | 63.0 | 71.6 | 80.4 | 56.5 | 40.4 | 46.3 | 37.1 |
| 100 mM acetic acid pH 2.8 | G | 93.3 | 92.9 | 93.9 | 96.5 | 82.8 | 70.9 | 77.3 | 69.8 |
| 150 mM acetic acid pH 2.7 | H | 91.2 | 96.5 | 100.0 | 98.8 | 91.6 | 82.1 | 87.4 | 82.7 |
Case study 2. Accelerating cell line development through liquid handling robotics
In some alternative applications, the rapid recycling of HTPD units might be inappropriate due to the possibility of cross-contamination. In this case study, we demonstrate the rapid purification of unfiltered centrifuged supernatant from 48× ambr 15 bioreactors via a high-throughput protein A 96-well screening plate on a liquid handling platform. The objective was to generate purified IgG suitable for evaluating the performance of each bioreactor, to facilitate cell line selection.
Materials
- Freedom EVO™ 150 liquid handling platform with integrated Te-Chrom™ capability (Tecan)
- Fibro adsorbent material functionalized with protein A, 60 μL matrix volume, 96-well plate
- Platform buffers for standard GSK protein A chromatography process
- 48× ambr 15 bioreactors (Sartorius)
- Sorvall™ Legend RT Bench-top centrifuge (Thermo Scientific)
Method
As depicted in Figure 3, the bioreactors were benchtop-centrifuged in a bespoke 3-D printed carrier, and then transferred to the liquid handling deck. Supernatant from each individual bioreactor was aspirated via liquid handling and directly loaded in parallel sets of 8 individual chambers of the 96-well plate Fibro adsorbent material. Each well was washed, and then eluted into a single fraction with protein concentration measured and titrated to neutral pH for subsequent assays.
Results
Samples from the 48× ambr 15 bioreactor supernatants were purified, with concentrations determined and pH adjusted in under 2 h, with 500 to 600 μg IgG per sample collected in a 200 μL pool. With the single-use modality of the high-throughput plate format, no filtration was required prior to the loading of sample onto the Fibro adsorbent material; additional purified IgG could be generated by cycling the units several times. The work demonstrates a fully integrated automated platform operating in under 2 h, enabled by the performance of the Fibro adsorbent material.
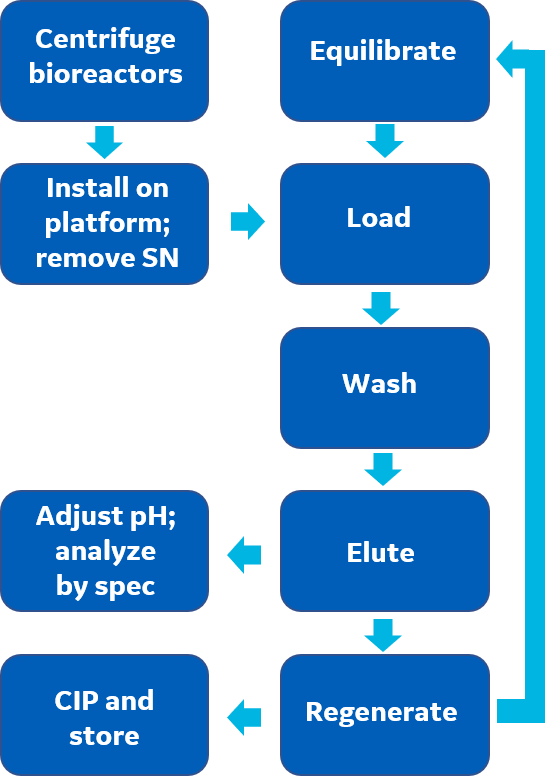
Fig 3. Process flow diagram for purification of monoclonal antibody from ambr 15 bioreactors using a liquid handler from Tecan. SN is supernatant.
Conclusion
We have demonstrated the utility of Fibro adsorbent material in different HTPD applications. Very small quantities of adsorbent can yield a great deal of data and process development understanding. This is due to the immediate mass transfer observed with the Fibro adsorbent material, meaning less complexity when scaling up. The scalability criterion of the unit format means that methods can be easily scaled.
Small, scalable units enable a range of process parameters to be explored with minimal feed requirements. Units can be cycled up to 200 times to add confidence to repeats and adsorbent lifetime understanding, as well as produce meaningful amounts of material for further study. All units can be run on standard ÄKTA systems. The 96-well format could be used where carryover might be an issue, for example, in cell line selection, foulant material, static studies (long buffer holds, base stability, etc.). The 96-well format fits seamlessly into Te-Chrom-enabled Tecan liquid handling platforms.
References
- Feliciano, J. et al.Evaluating high-throughput scale-down chromatography platforms for increased process understanding.Engineering in Life Sciences16, 169–178 (2016).
- Hardick, rel="noopener noreferrer" O. et al.Nanofiber adsorbents for high productivity downstream processing.Biotechnology and Bioengineering110, 1119–1128 rel="noopener noreferrer" (2013).
- Evans S. et al.Optimization of a micro-scale, high throughput process development tool and the demonstration of comparable process performance and product quality with biopharmaceutical manufacturing processes.Journal of Chromatography A.1506, 73–81 (2017).