By Monika Seidel PhD, Senior Development Scientist, Genomics and Cellular Research, Cytiva
1. Introduction
Personalized medicine relies on accurate and sensitive profiling of tumor genetic make-up for targeted therapy decisions. Clinicians now routinely implement this approach in patients with advanced non-small cell lung cancer (NSCLC), who undergo testing for the presence of genetic aberrations in five most frequently mutated genes in NSCLC (EGFR, ALK, ROS1, BRAAF NTRK NTRK) and against which there is an approved targeted therapy (1).
Compared with standard chemotherapy, precision medicine offers prolonged progression-free survival and significant reduction in side-effects. Unfortunately, a large population of patients eventually develop acquired resistance leading to rapid disease progression. In some instances the initial response to therapy is either limited or non-existent. Early detection of resistance through real-time monitoring of changes in the tumor’s genetic landscape is emerging as a new approach to facilitate prompt and informed implementation of the second-line therapy. Genetic profiling of spatial and temporal tumor evolution is becoming a key element in research aiming to identify novel molecular drivers of resistance for targeted drug development.
At the time of the diagnosis, the detection of actionable mutations is heavily dependent on the availability of tumor tissue, which remains a gold standard in clinical practice. The use of liquid biopsy for such profiling is only recommended in circumstances where a solid biopsy is not feasible. However, real-time monitoring of cancer genetic evolution is difficult or even impossible to achieve with solid tissue biopsy. Such an approach requires repeated surgery to obtain tumor tissue, with potential need for patient hospitalization and possibility of complications. At the advanced stage of the disease a biopsy of a single lesion can be regarded as insufficient to obtain a full picture of tumor heterogeneity and to detect genetic alterations driving disease progression. In this context, real time monitoring of therapeutic response can only be achieved through liquid biopsy, an approach that is non-invasive and capable of capturing spatial and temporal differences in the cancer genetic landscape.
2. Study design
The purpose of the study was to evaluate the performance and suitability of Sera-Xtracta™ Cell-Free DNA Kit* for plasma based-monitoring of therapeutic response and resistance in advanced NSCLC in patients positive for epidermal growth factor receptor (EGFR) biomarker and undergoing treatment with tyrosine kinase inhibitors (TKI). We contracted with Biogazelle, of Gent, Belgium to conduct independent experiments and data analysis for our study.
NSCLC is a leading cause of cancer mortality worldwide, mostly due to the fact that the diagnosis is being made at a very late stage with metastasis present and a five year survival rate lower than 15% (2). Mutations in the EGFR gene constitute a prevailing genetic cause of the disease. Over 90% of the EGFR mutations involve deletions in exon 19 or substitutions in exon 20 (L858R), both being predictive of positive response to first- and second-generation EGFR tyrosine kinase inhibitors (3). Unfortunately, after the first line treatment, nearly all patients eventually develop disease progression either due to the acquired resistance or due to the presence of resistance mutations even before the treatment commenced. Although the mechanism for secondary resistance might involve activation of by-pass pathways or histological transformation, in most cases it can be attributed to secondary mutations in the EGFR gene, with the T790M SNV being the prevailing substitution found in around 60% of cases following secondary tissue biopsy (3). A third generation TKI therapy against this mutation is in clinical practice (1).
In the context of almost inevitable secondary resistance triggered by drug-induced clonal selection pressure, the real-time monitoring of patients’ response to the therapy in advanced NSCLC appears a compelling practice for early detection of disease progression to facilitate prompt change in the therapeutic approach. With an effective treatment, a gradual decline in plasma tumor burden would be expected to occur. This phenomenon would be reflected in the gradual drop of mutation allele frequency (MAF) of the primary driver mutation until a complete absence thereof. Detection of additional mutations absent at the start of the treatment would be suggestive of a secondary resistance indicating tumor evolution.
For our study, the plasma from three patients with advanced disease was collected in Cell-Free BCT tubes (Streck) at three consecutive time points starting from the first day (baseline) of targeted treatment (Fig 1). At the point of cancer diagnosis, all subjects were tested for mutations in primary cancer drivers, i.e., ALK, ROS, and EGFR, and for the presence of the histological marker programmed cell death (PD-1) using tissue biopsy. The presence of EGFR mutations was confirmed in all three patients and consequently all subjects were given tyrosine kinase inhibitors either as a standalone treatment or in combination with a chemotherapeutic agent (Table 1). Based on radiological follow-up, the treatment regimen was effective for Patient 1, whereas no benefit was observed for either Patient 2 or 3.
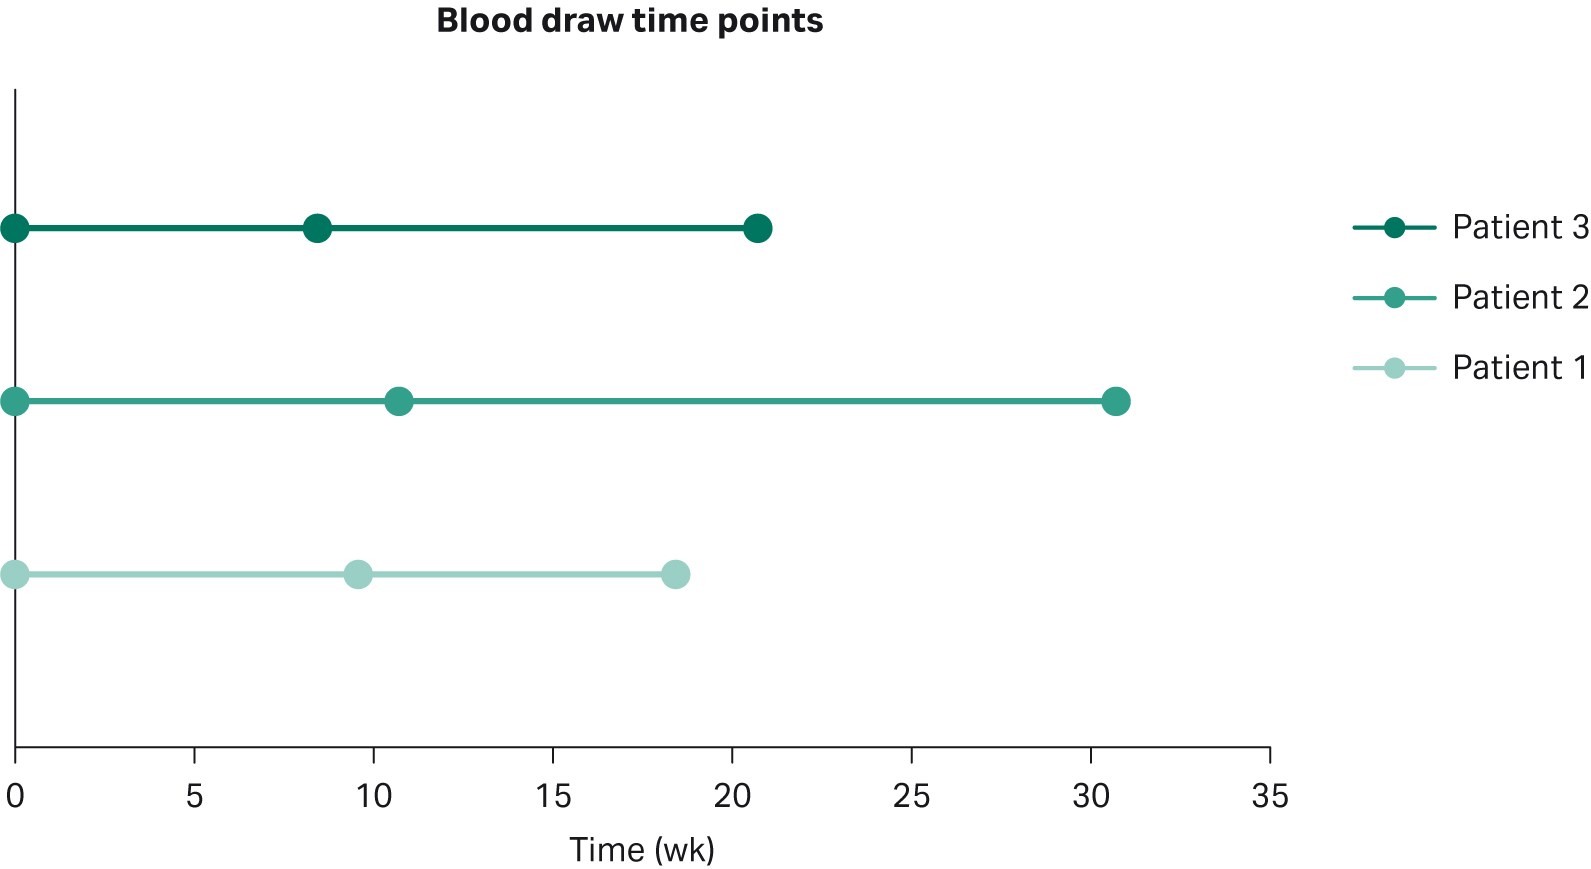
Fig 1. Blood draw time-points; note that T0 represent the start of the targeted therapy
Table 1. Patients’ clinical details
| Patient | Gender | Morphology/stage | Treatment classification | Therapeutic agent #1 | Therapeutic agent #2 | Biomarker 1 | Biomarker 2 | Treatment response |
| 1 | M | Adenocarcinoma, IV | non-specific KI + chemotherapy | Nintedanib | Docetaxel | EGFR: del exon 19 (E746_T751del) | PD-1 positive | Partial remission |
| 2 | F | Acinar cell adenocarcinoma, IV | first generation EGFR KI | Erlotinib | EGFR L858R | Progressive disease | ||
| 3 | F | Adenocarcinoma, IV | first generation EGFR KI | Gefitinib | EGFR L858R | Progressive disease |
3. Methods
All plasma samples were purchased from Indivumed GmbH (plasma obtained through double spin from blood collected in Cell-Free DNA BCT tubes). Cell-Free DNA (cfDNA) was extracted from 1 mL of plasma using Sera-Xtracta Cell-Free DNA Kit and two market leading competitor’s kits, MagMAX™ Cell-Free DNA Isolation Kit (ThermoFisher Scientific) and QIAamp™ Circulating Nucleic Acid Kit (Qiagen) following manufacturers’ protocols.
For T0 time point, two replicates of 1 mL of plasma were extracted with each kit, one replicate per kit was used for the remaining two time points (i.e., T1 and T2). All samples were processed at Biogazelle (note that no carrier RNA was added to buffer ACL in the Qiagen kit workflow as per service provider SOP).
The yield and fragment distribution of cfDNA extracted from plasma collected at T0 was analyzed using Qubit fluorometer (ThermoFisher Scientific) and capillary electrophoresis on HS DNA Chip using Bioanalyzer (Agilent) prior to sequencing. Targeted next-generation sequencing (NGS) was performed on S5XL platform (Ion Torrent) using AmpliSeq™ technology CP-Alpha v3 panel (ThermoFisher Scientific) at Bio.be (Institute of Pathology and Genetics). Libraries were prepared with maximum available input for all samples. For panel coverage, see Table 2. Data were analyzed using NextGENe (SoftGenetics) software; assay limit of detection is 1% (for samples with minimum coverage > 10000 reads and read balance > 0,25). Only calls that fulfilled these criteria were considered positive.
Table 2. CP-Alpha v3 panel coverage
| Gene | Details |
| EGFR | exons 18, 19, 20 and 21 |
| KRAS et NRAS | codons 12, 13, 59 à 61, 117 and 146 |
| BRAF | exons 11 and15 |
| PIK3CA | exons 10 and 21 |
| ALK | exons 22, 23 and 25 |
| DDR2 | codon 768 |
| PTEN | codon 233 |
| AKT1 | codon 17 |
| MEK1 | codons 56 and 67 |
| ERBB2 | exon 20 |
| cKIT | exons 9, 11, 13, 14, 17, 18 and junction intro 10/exon 11 |
| PDGFRa | exons 12, 14 and 18 |
| IDH1 | exon 4 |
| IDH2 | exon 4 |
| H3F3A | exon 2 |
| HRAS | exon 2 |
| GNAS | exons 8 and 9 |
| ESR1 | exons 8 and 9 |
| GNAS | exons 8 and 9 |
| ESR1 | exons 8 and 9 |
Extracted cfDNA from the second replicate representing T0 time point and the samples from the two remaining time-points (i.e., T1 and T2) were quantified using NanoDrop™ (ThermoFisher Scientific) and Qubit™ (ThermoFisher Scientific) and subjected to digital droplet PCR (ddPCR) using IDEGFR(b) SENSI-v3-50 Kit (ID Solutions) on QX200TM Droplet DigitalTM PCR system (Bio-Rad). The kit is a multiplex quantification system that allows for the simultaneous detection of the EGFR most common primary driver mutations (Tables 3 and 4). All samples were run in duplicates. Maximum available input (5 µL per replicate) was used in ddPCR unless the upper input limit for the asay was exceeded (16 ng).
Table 3. Targeted mutations and alterations detected by IDEGFR(b) SENSI-v3-50 Kit
| Exon | Mutations | Base Change | Cosmic ID |
| Exon 19 | p.E746_A750del (1) | c.2235_2249del15 | COSM6223 |
| p.E746_A750del (2) | c.2236_2250del15 | COSM6225 | |
| p.L747_P753>S | c.2240_2257del18 | COSM12370 | |
| p.E746_T751>I | c.2235_2252>AAT (complex) | COSM13551 | |
| p.E746_T751del | c.2236_2253del18 | COSM12728 | |
| p.E746_T751>A | c.2237_2251del15 | COSM12678 | |
| p.E746_S752>A | c.2237_2254del18 | COSM12367 | |
| p.E746_S752>V | c.2237_2255>T(complex) | COSM12384 | |
| p.E746_S752>D | c.2238_2255del18 | COSM6220 | |
| p.L747_A750>P | c.2238_2248>GC (complex) | COSM12422 | |
| p.L747_T751>Q | c.2238_2252>GCA (complex) | COSM12419 | |
| p.L747_E749del | c.2239_2247del9TTAAGAGAA | COSM6218 | |
| p.L747_S752del | c.2239_2256del18 | COSM6255 | |
| p.L747_A750>P | c.2239_2248TTAAGAGAAG>C(complex) | COSM12382 | |
| p.L747_P753>Q | c.2239_2258>CA (complex) | COSM12387 | |
| p.L747_T751>S | c.2240_2251del12 | COSM6210 | |
| p.L747_T751del | c.2240_2254del15 | COSM12369 | |
| p.L747_T751>P | c.2239_2251>C(complex) | COSM12383 | |
| p.L747_T751del | c.2238_2252del15 | COSM23571 | |
| p.L747_S752>Q | c.2239_2256>CAA | COSM12403 | |
| p.E746_T751>V | c.2237_2252>T | COSM12386 | |
| p.E746_T751>T | c.2236_2253> ACG | / | |
| p.L747_A750>P | c.2239_2250>CCC | / | |
| p.L747_K754>QL | c.2239_2261>CAATT | / | |
| p.E746_K754>EQHL | c.2238_2261>GCAACATCT | / | |
| p.E746_S752>EQ | c.2238_2256>GCAA | / | |
| p.E746_A750>QP | c.2236_2248>CAAC | COSM13557 | |
| p.E746_T751>Q | c.2236_2253>CAA | COSM22999 | |
| Exon 21 | p.L858R | COSM6224 | c.2573-2574TG>GT | c.2573T>G | COSM12979 |
| p. L861Q | c.2582T>A | COSM6213 |
Table 4. Limit of Blank (Lob) at 95% Confidence Interval for the ARM-IDEGFR(b) sensi-v3 defined for samples of circulating DNA.
| Targets | Number of replicates | LoB95%
(Total positive droplets) |
Considered positive
(Total positive droplets) |
| L861Q | Single | 0 | 2 |
| Duplicate | 0 | 2 | |
| Triplicate | 0 | 2 | |
| L858R/Del19 | Single | 0 | 2 |
| Duplicate | 0 | 2 | |
| Triplicate | 0 | 2 |
4. Results
4.1 cfDNA yield and fragment size distribution
The yield of DNA extracted at each timepoint with all three cfDNA extraction kits was estimated using Qubit (Fig 2). There was no statistically significant difference in the performance between Sera-Xtracta Cell-Free DNA Kit and MagMAX Cell-Free DNA Isolation Kit (based on one-way Anova with Dunnett’s post hoc test). The performance of the Qiagen kit was significantly worse (p<0.05). We must emphasize, however, that an alternative protocol suggested by the manufacturer was used and no carrier RNA was added. This was to avoid overestimation of cfDNA yield when using absorbance at 260 nm. Although Biogazelle, our service provider, has successfully implemented and routinely used this approach in the extraction of nucleic acid, the absence of carrier RNA likely contributed to the observed low cfDNA recovery in samples processed with QIAamp Circulating Nucleic Acid Kit.
Fragment size profile for samples subjected to NGS is presented in Figure 3. Since all blood specimens were collected in cfDNA stabilizing tubes and processed using double centrifugation protocol, the level of gDNA release was expected to be minimal. This is indeed the case for Patients 1 and 2, where no gDNA carry-over is present regardless of the kit used. The plasma sample obtained from Patient 3 appears to contain gDNA as shown in the electropherograms from samples processed with MagMAX Cell-Free DNA Isolation Kit and QIAamp Circulating Nucleic Acid Kit (additional peaks >> 500 bp) but absent in the sample extracted with Cytiva kit (Fig 3).
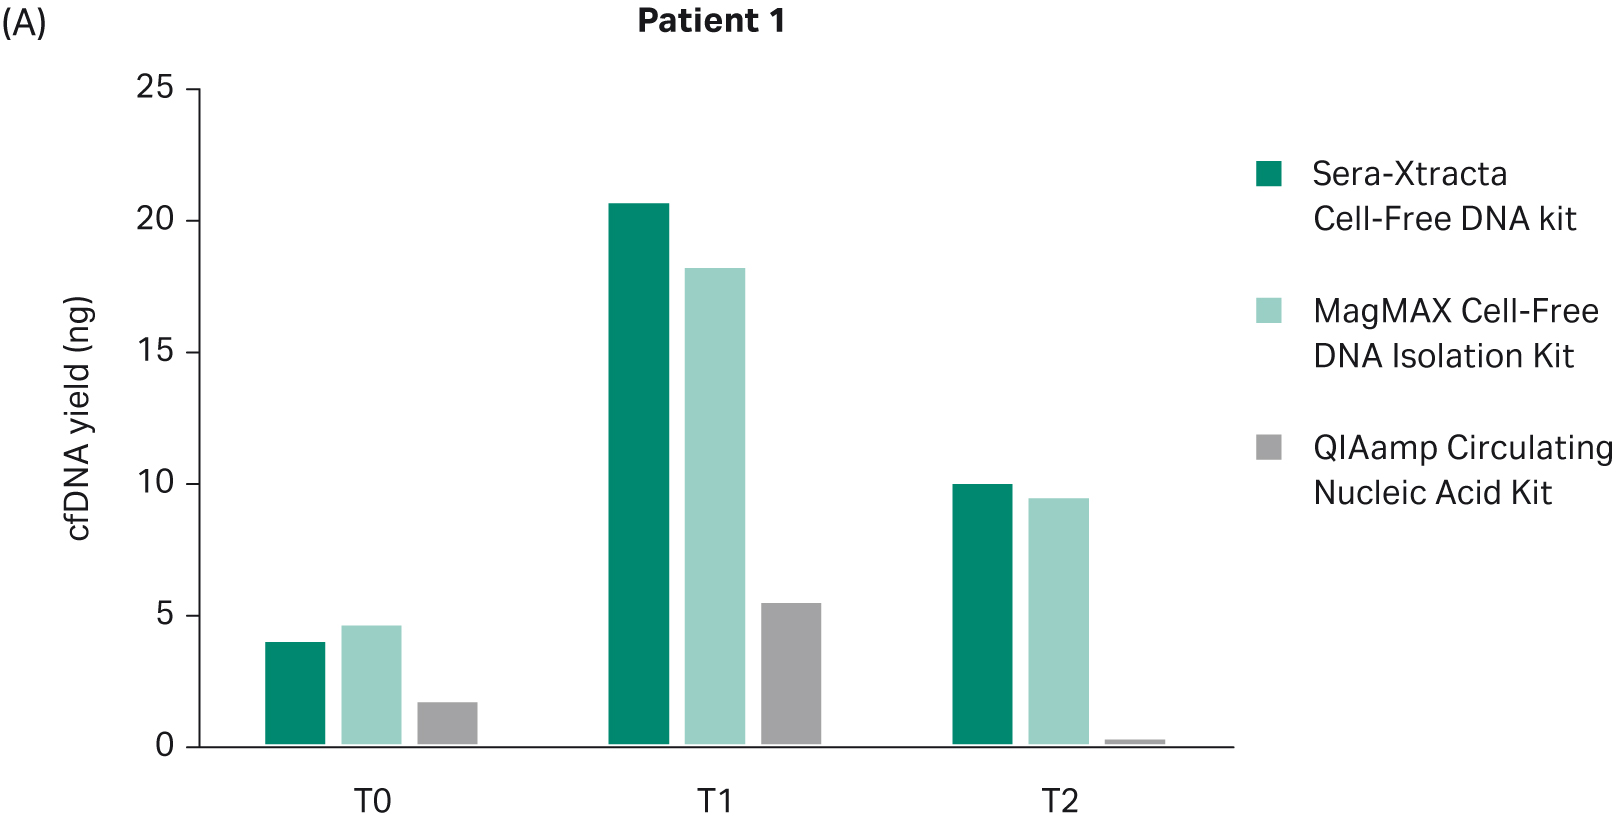
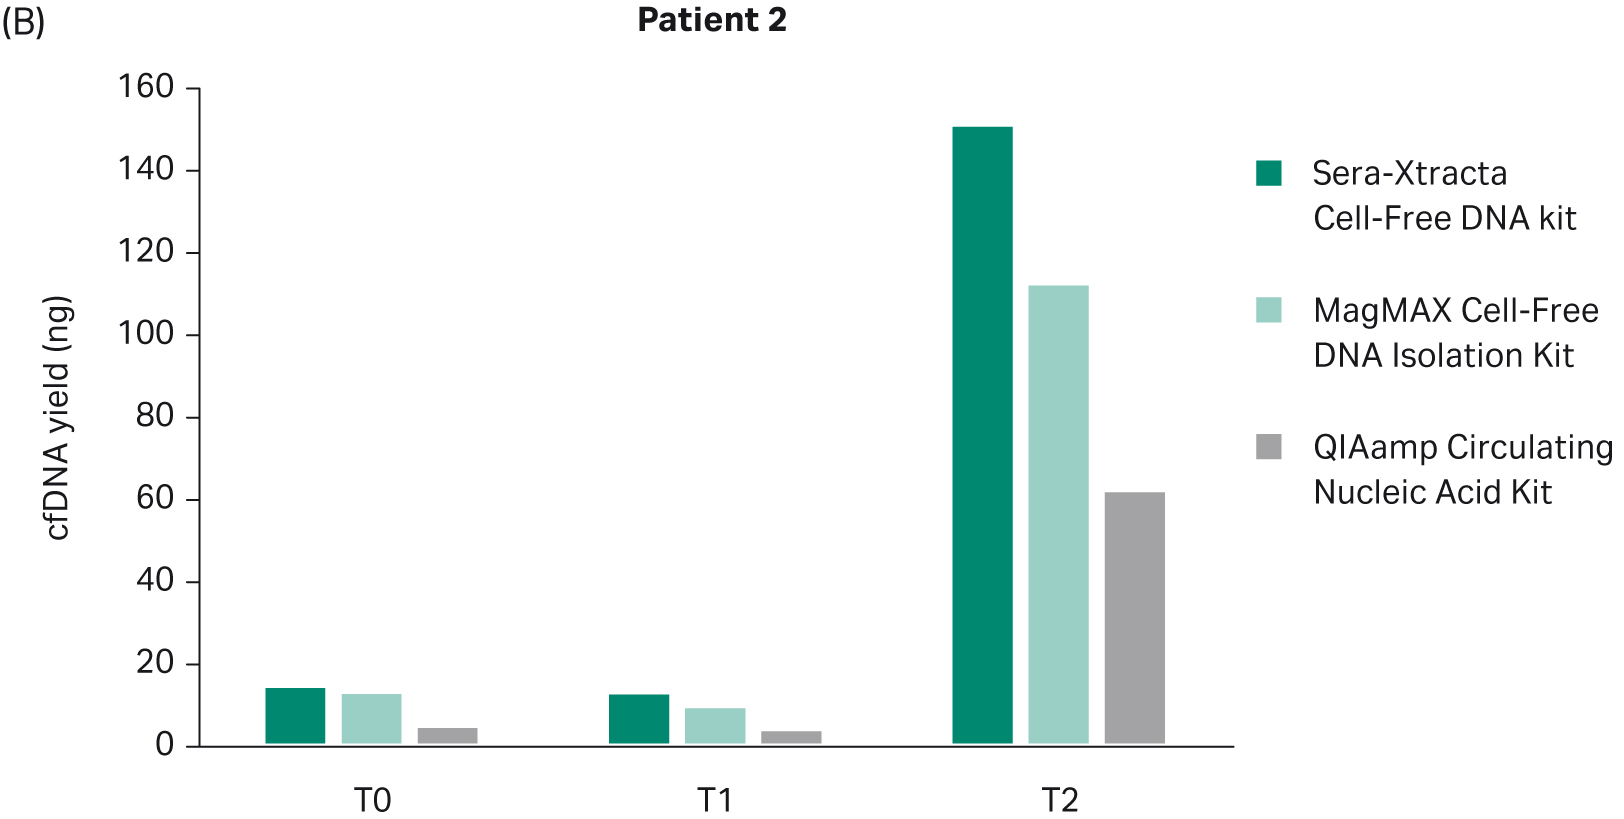
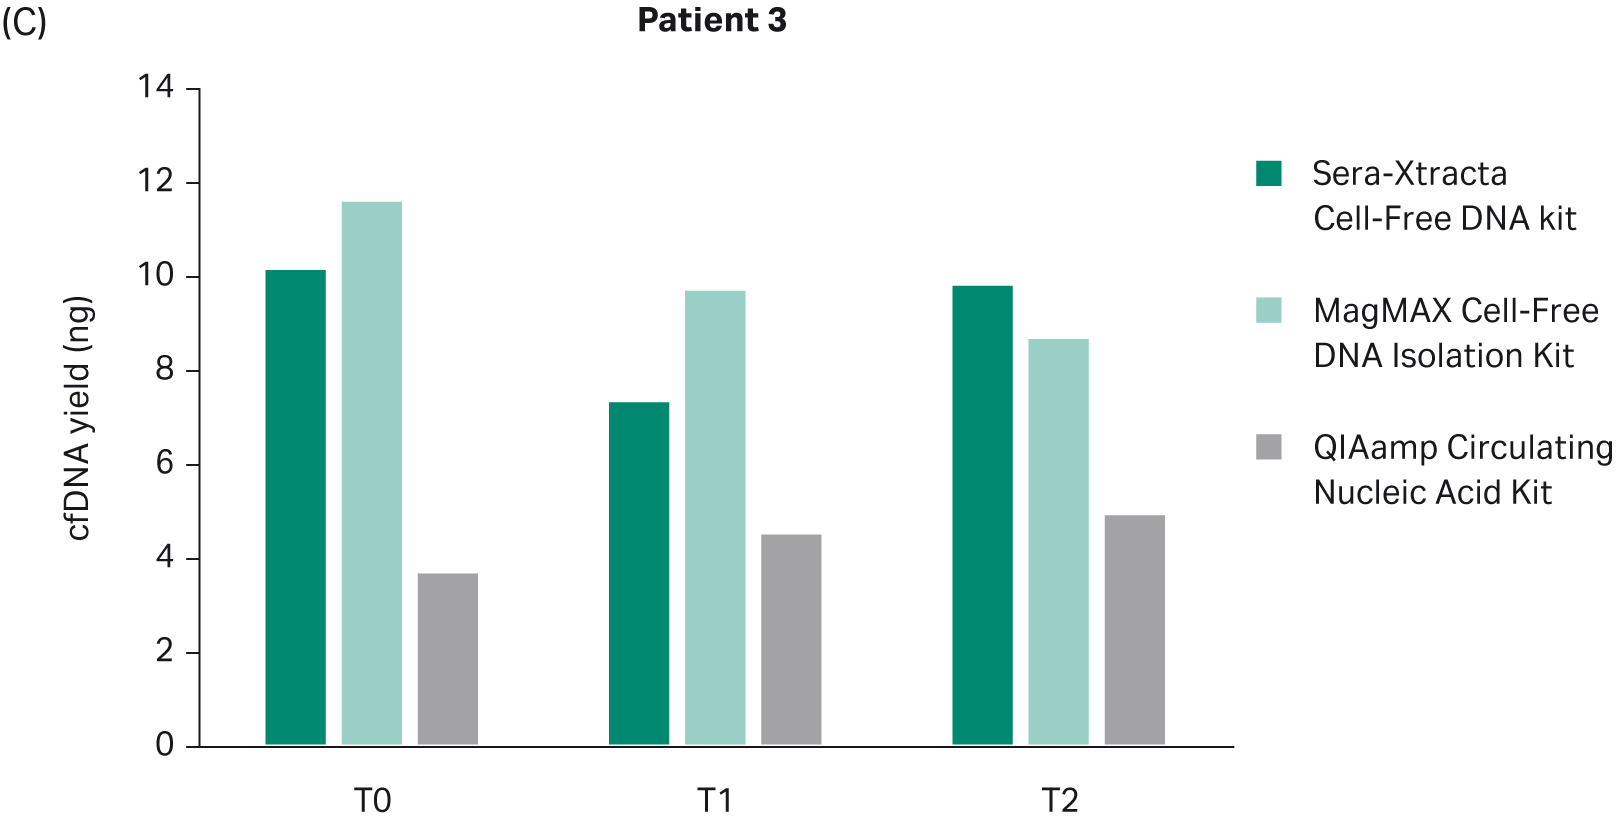
Fig 2. Total DNA yield, quantified using Qubit, at T0-T2: bar chart summarizing total DNA yield obtained from 1 mL of plasma processed with three extraction kits: Sera-Xtracta Cell-Free DNA Kit, MagMAX Cell-Free DNA Isolation Kit and QIAamp Circulating Nucleic Acid Kit.
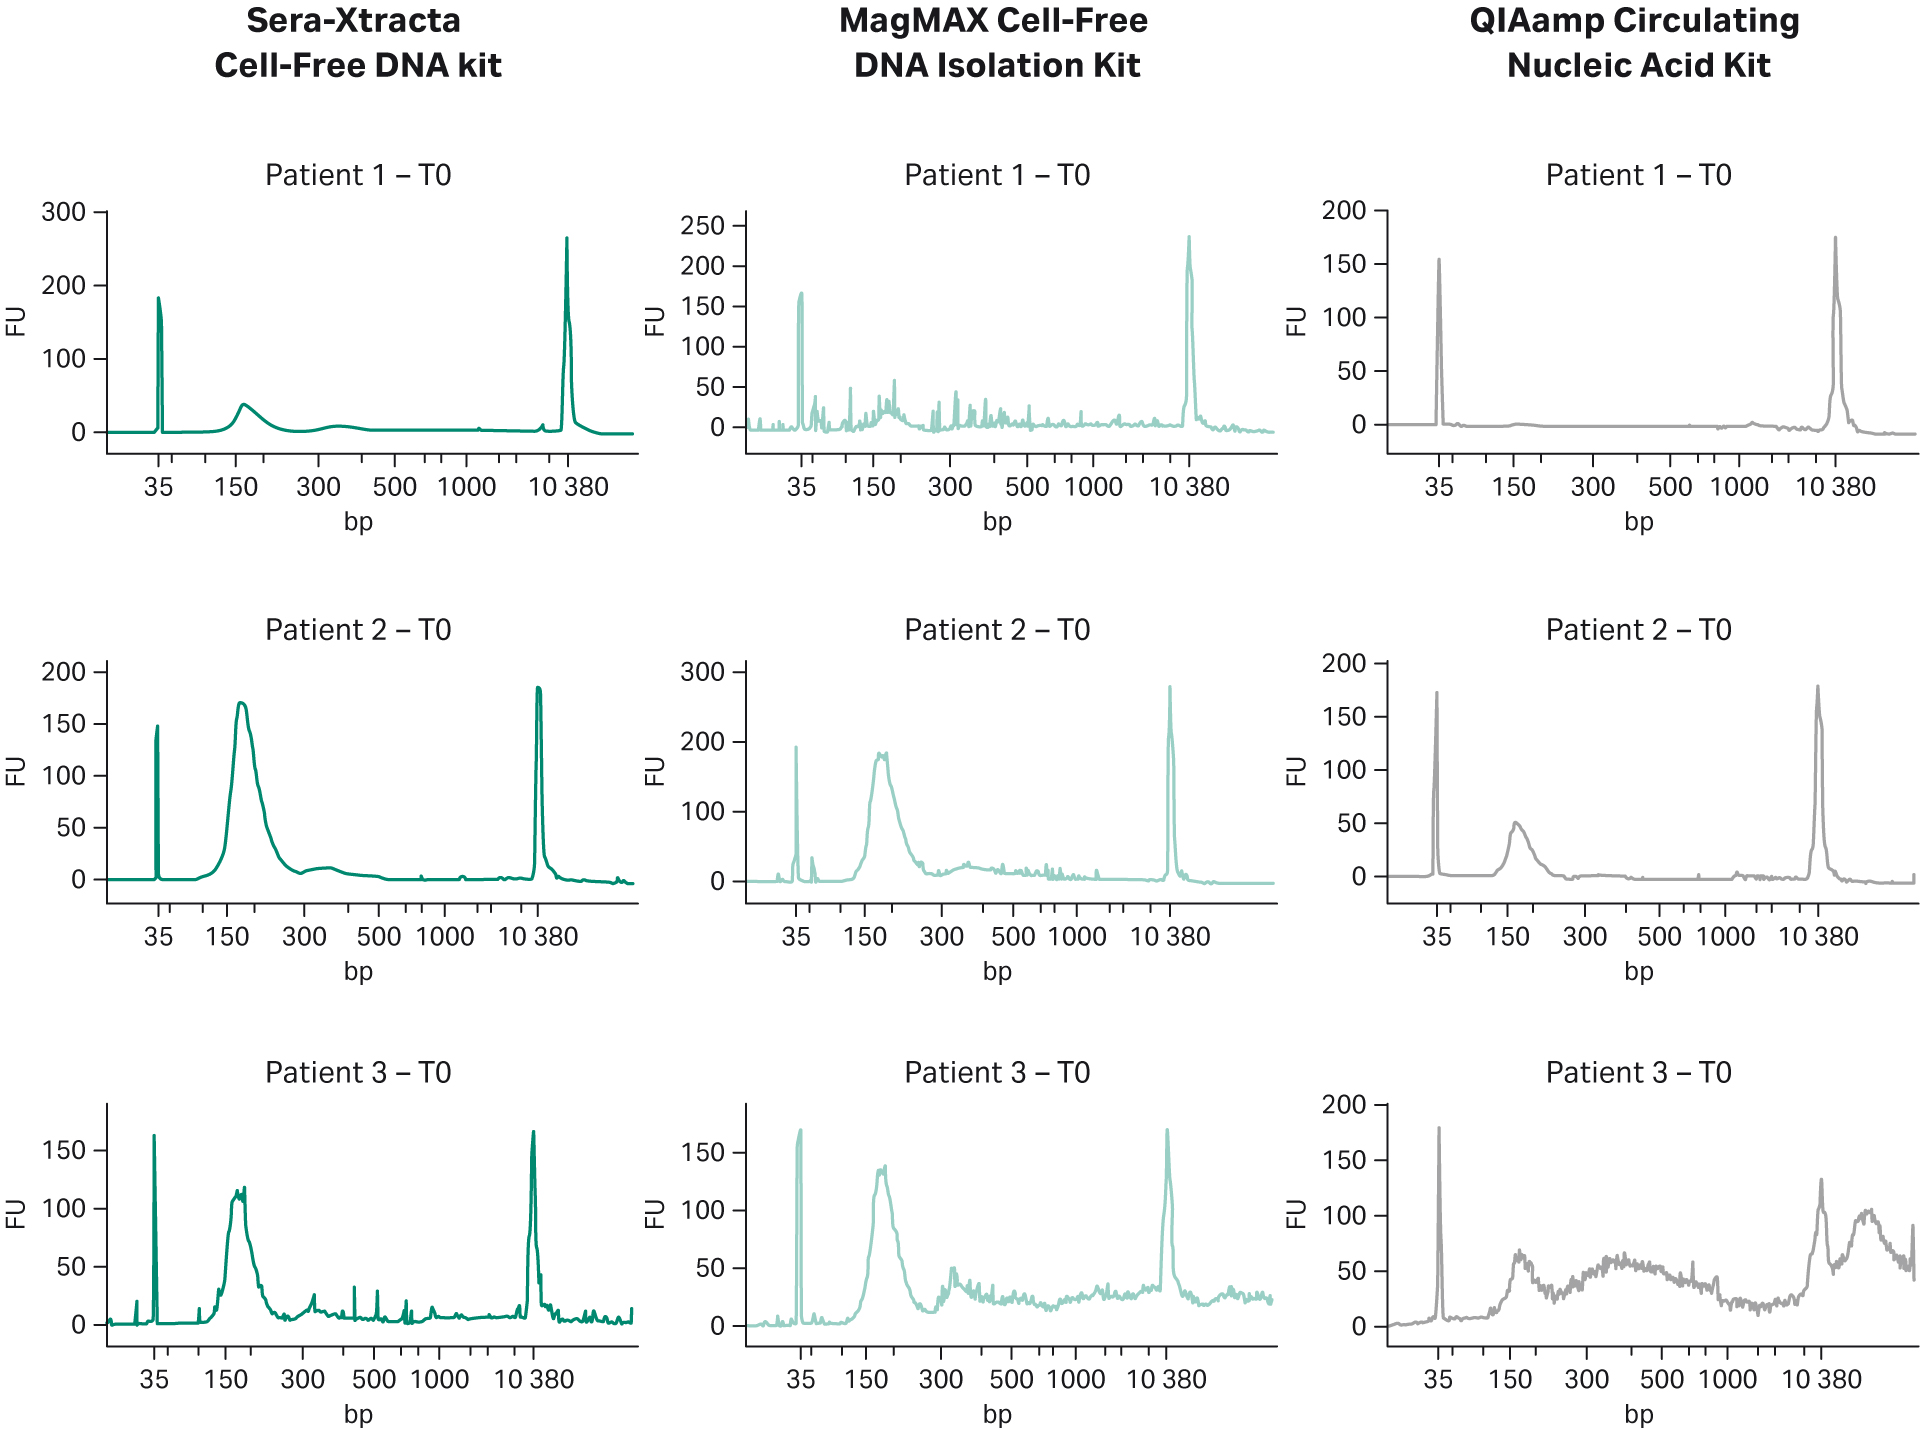
Fig 3. cfDNA recovery and size distribution from plasma at T0: representative electropherograms showing DNA fragment distribution obtained from plasma at T0 (baseline). 1 mL of plasma was independently processed with three extraction kits: Sera-Xtracta Cell-Free DNA Kit and MagMAX Cell-Free DNA Isolation Kit and QIAamp Circulating Nucleic Acid Kit following the manufacturers’ protocol (note that no carrier RNA was added to buffer ACL in the Qiagen workflow). Extracted samples were analyzed on 2100 Bioanalyzer using High-Sensitivity DNA Chip.
4.2. Targeted NGS results and concordance between tissue biopsy and plasma
Targeted NGS was used to assess mutation profile in plasma for all three patients at the start of the kinase inhibitor therapy and compare biomarker profile to tissue biopsy. All patients included in our study had been diagnosed with advanced stage cancer, where tumor burden in the blood is expected to reach high levels enabling confident detection of cancer associated mutations. Samples processed with Sera-Xtracta Cell-Free DNA Kit showed 100% concordance with tissue biopsy results, and the presence of EGFR driver mutation was confirmed in all patients. However, this was not the case when using alternative cfDNA extraction kits: the main driver mutation was only confirmed in one out of three patients (Table 5). No additional cancer biomarkers tested were detected in any of the samples.
Table 5. Biomarkers, MAF and sequencing depth detected at T0 in plasma samples in targeted NGS.
| Sample | Mutation | AA change | Sera-Xtracta Cell-Free DNA | MagMAX™ cfDNA Isolation Kit | QIAamp Circulating Nucleic Acid Kit | |||
| MAF | Sequencing Depth | MAF | Sequencing Depth | MAF | Sequencing Depth | |||
| Patient 1 | EGFR del exon 19 | Leu747_Pro753del | 3% | 22500 | not detected | 16273 | not reached | |
| Patient 2 | EGFR del exon 19 | E746_T751del | 5% | 14413 | not reached | 6.5% | 15241 | |
| Patient 3 | EGFR SNV | Leu858Arg | 1% | 15018 | 2% | 26900 | not detected | 17309 |
4.3. Validation of targeted NGS by digital droplet PCR
Biogazelle used digital droplet PCR to validate targeted NGS results from plasma samples collected at T0 (Table 6). The presence of EGFR mutation was successfully confirmed in all samples processed with Sera-Xtracta Cell-Free DNA Kit, with excellent correlation in mutation frequency between the two detection methods (Pearson r=0.98) for the Cytiva kit (Fig 4). There was no positive correlation between NGS results and ddPCR results for MagMAX Cell-Free DNA Isolation Kit (Pearson r= -0.75). A high concordance between ddPCR and NGS results obtained for QIAamp Circulating Nucleic Acid Kit (Pearson r= 0.91) can be explained by the fact that neither ddPCR nor NGS was able to confirm the presence of EGFR mutation in Patient 3.
Table 6. Biomarkers and MAF detected at T0 in plasma samples in ddPCR and targeted NGS at T0
| Sample | Mutation | AA change | Sera-Xtracta Cell-Free DNA | MagMAX™ Cell-Free Isolation DNA Kit | QIAamp Circulating Nucleic Acid Kit | |||
| MAF by NGS | MAF by ddPCR | MAF by NGS | MAF by ddPCR | MAF by NGS | MAF by ddPCR | |||
| Patient 1 | EGFR del exon 19 | Leu747_Pro753del | 3% | 2.18% | 0% | 1.75% | 0% | 2.59% |
| Patient 2 | EGFR del exon 19 | E746_T751del | 5% | 4.51% | 0% | 5.43% | 6.5% | 6.13% |
| Patient 3 | EGFR SNV | Leu858Arg | 1% | 0.99 | 2% | 0 | 0% | 0% |
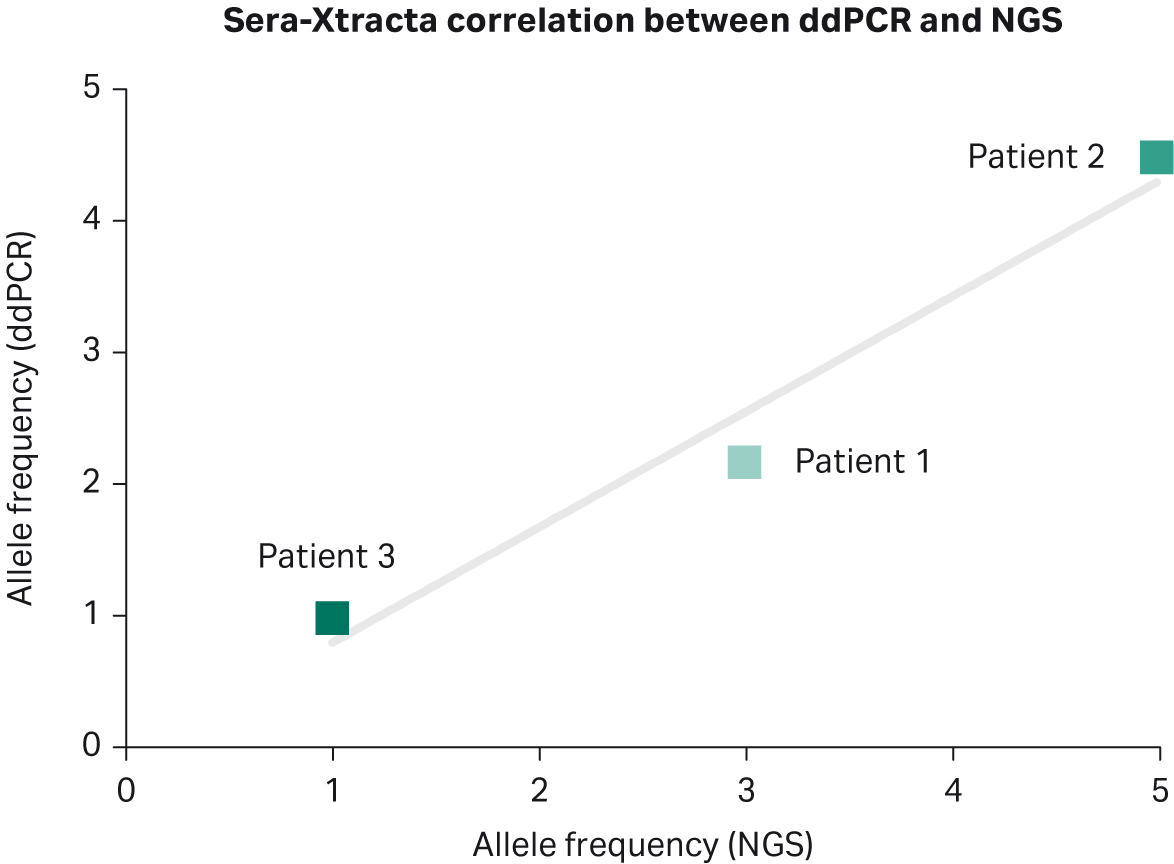
Fig 4. Comparison between targeted NGS and ddPCR for Sera-Xtracta cfDNA Kit at T0: mutation allele frequency obtained using targeted NGS is (X axis) compared to allele frequencies estimated during ddPCR (Y axis) for identical genomic positions. The solid line represents linear model.
4.4. Monitoring disease progression through evaluation of the tumor burden in plasma (correlation between liquid biopsy findings and clinical response to therapy)
We further evaluated whether the presence and the relative level of primary driver mutation can be used to monitor the response to therapy and as such constitute a method of clinical utility for early detection of therapy resistance. Digital droplet PCR was used to estimate the level of MAF of primary driver mutation at two consecutive time points during targeted therapy.
In line with clinical findings showing partial remission in Patient 1, no EGFR mutation was detected at the timepoints investigated (nine weeks and 18 weeks) (Fig 5). All extraction kits performed comparably (Table 7).
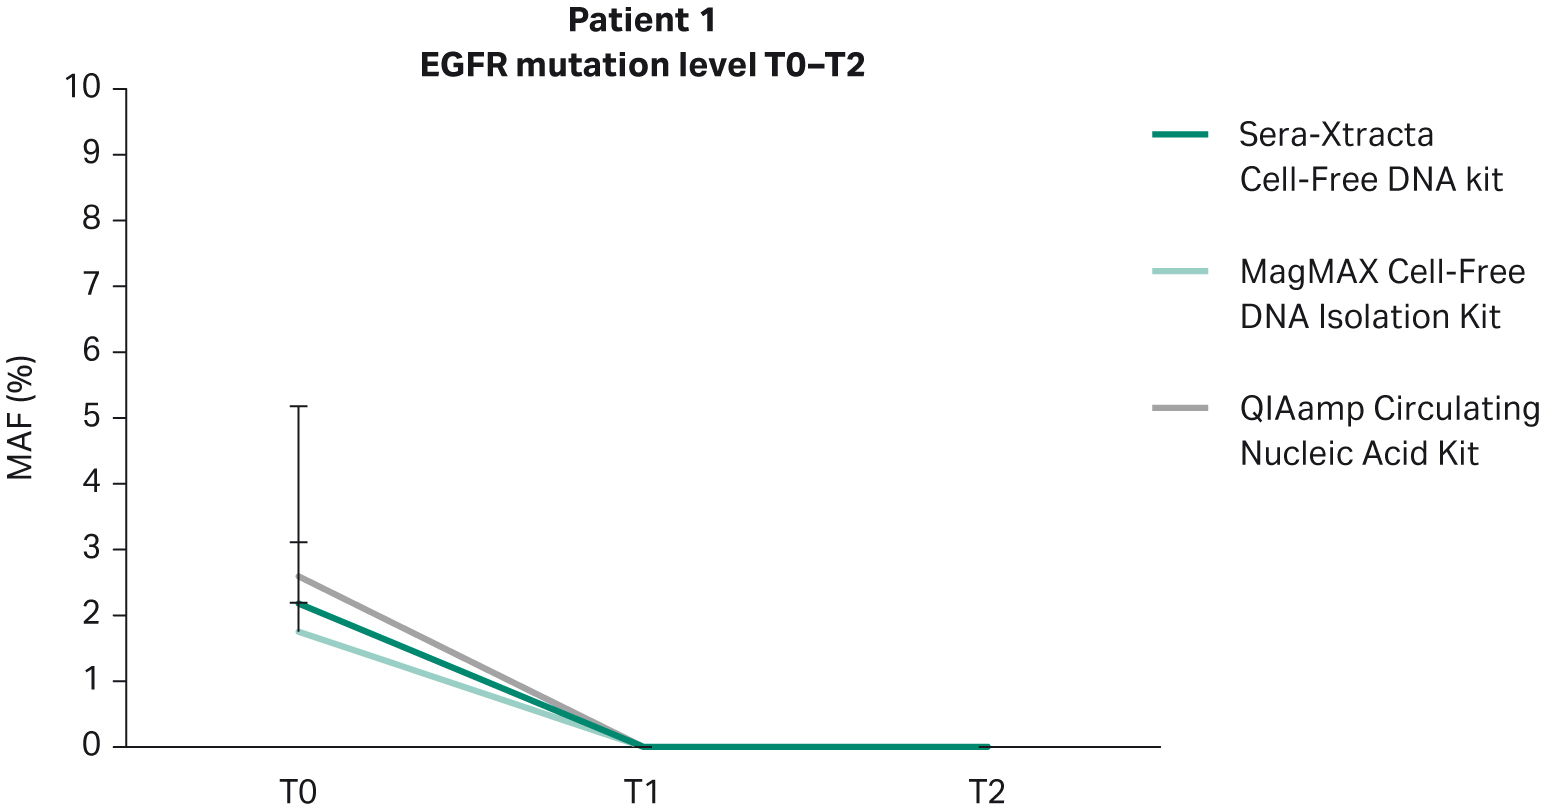
Fig 5. Monitoring tumor burden in response to targeted therapy in Patient 1: temporal changes in the level of primary driver mutation (EGFR del exon 19) in plasma evaluated with ddPCR at three consecutive time points (0, 9 weeks and 18 weeks). 1 mL of plasma was processed with three cfDNA extraction kits as described earlier.
Table 7. Temporal changes in MAF during targeted therapy (ddPCR) in plasma of Patient 1
| Patient 1
(partial remission) |
Mutation | Sera-Xtracta Cell-Free DNA | MagMAX™ Cell-Free DNA Isolation Kit | QIAamp Circulating Nucleic Acid Kit |
| MAF | MAF | MAF | ||
| T0 | EGFR del exon 19 | 2.18% | 1.75% | 2.59% |
| T1 | 0% | 0% | 0% | |
| T1 | 0% | 0% | 0% |
Based on clinical data provided, Patient 2 did not respond to targeted therapy and presented with progressive disease. This is in agreement with the findings from plasma: in all samples extracted with the Sera-Xtracta Cell-Free DNA Kit, the presence of primary EGFR driver mutation was confirmed at all time points investigated albeit at different levels (Table 8). At baseline (T0) MAF was estimated to be around 5%. Although the level of MAF decreased to 1% at 11 weeks indicative of a decline in tumor burden, the treatment was not effective, and the disease progressed rapidly (MAF at 37% at T2; 31 weeks) (Fig 6).
The presence of cancer biomarker in plasma at T1 shows a clear utility of cfDNA-based analysis to track the disease progression before clinically recognized symptoms appear. Liquid biopsy monitoring provides an opportunity for additional testing to identify actionable biomarkers of tumor evolution and resistance, and allow for a prompt re-adjustment of therapeutic approach. This approach is only viable with analytical methods that provide the highest possible sensitivity. In this context, only the Sera-Xtracta Cell-Free DNA Kit enabled detection of primary driver mutation at T1 (Table 8).
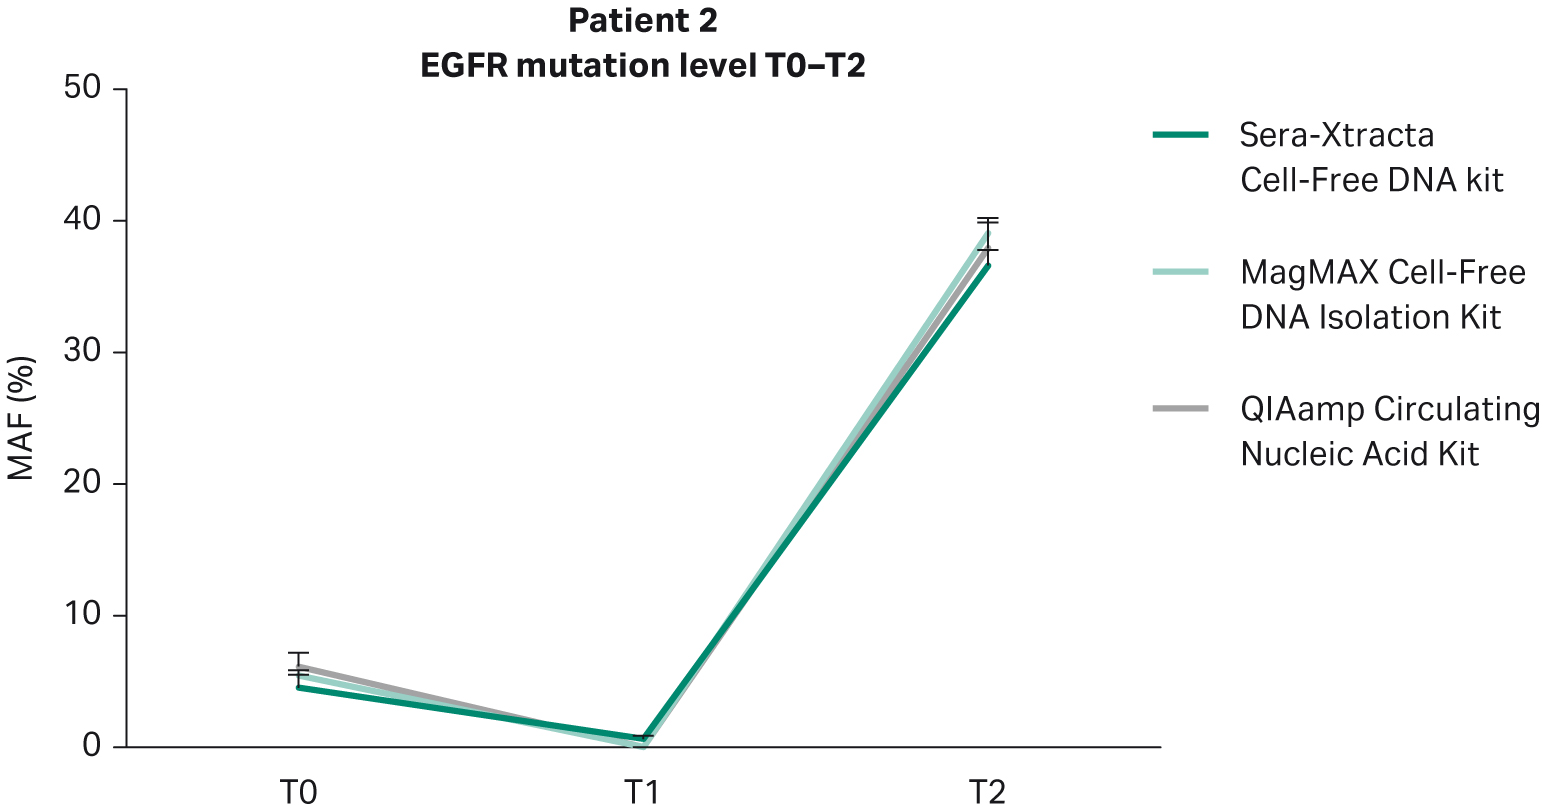
Fig 6. Monitoring of tumor burden in response to targeted therapy in Patient 2: temporal changes in the level of primary driver mutation (EGFR del exon 19) in plasma evaluated with ddPCR at three consecutive time points (0, 11 weeks and 31 weeks). 1 mL of plasma was processed with three cfDNA extraction kits as described earlier.
Table 8. Temporal changes in MAF during targeted therapy (ddPCR) in plasma of Patient 2
| Patient 2 (non-responder) | Mutation | Sera-Xtracta Cell-Free DNA | MagMAX™ Cell-Free Isolation DNA Kit | QIAamp Circulating Nucleic Acid Kit |
| MAF | MAF | MAF | ||
| T0 | EGFR del exon 19 | 4.51% | 5.43% | 6.13% |
| T1 | 1% | 0% | 0% | |
| T2 | 37% | 39% | 38% |
Based on clinical data, Patient 3 presented symptoms of progressive disease despite a targeted treatment regime. This again is reflected in the ddPCR results obtained from plasma samples processed with Sera-Xtracta Cell-Free DNA Kit (Fig 7, Table 9). At baseline, the MAF of primary driver mutation was estimated to be 1%; two months later the mutation was undetectable in plasma, suggesting a decline in tumor burden beyond the level of assay sensitivity. However, at 21 weeks MAF returned to baseline indicating therapy resistance. Significantly, no mutation was detected at baseline (T0) with any of the alternative kits (Table 9).
This outcome has important clinical implications. NSCLC is routinely diagnosed at a very advanced stage where tissue biopsy becomes unfeasible. In these circumstances, a liquid biopsy is considered a clinically relevant alternative for biomarker profiling (1).. Based on the presence of an actionable biomarker, a treatment regimen which involves targeted therapy can be undertaken. However, in the absence of such a biomarker, treatment options become limited and usually involve chemotherapy. One could imagine a likely scenario in which a liquid biopsy would constitute the only available sample type for Patient 3; the choice between different extraction kits could determine the therapeutic approach and ultimately influence clinical outcome.
Fig 7. Monitoring tumor burden in response to targeted therapy in Patient 3: temporal changes in the level of primary driver mutation (EGFR del exon 19) in plasma evaluated with ddPCR at three consecutive time points (0, 8 weeks and 21 weeks). 1 mL of plasma was processed with three cfDNA extraction kits as described earlier.
Table 9. Temporal changes in MAF during targeted therapy (ddPCR) in plasma of Patient 3
| Patient 3 (non-responder) | Mutation | Sera-Xtracta Cell-Free DNA | MagMAX™ Cell-Free DNA Kit | QIAamp Circulating Nucleic Acid Kit |
| MAF | MAF | MAF | ||
| T0 | EGFR Leu858Arg | 1.0% | 0.0% | 0.0% |
| T1 | 0.0% | 0.0% | 0.0% | |
| T2 | 0.9% | 0.0% | 1.4% |
5. Concluding remarks
Personalized medicine is revolutionizing cancer treatment with unprecedented results in molecularly defined patient subgroups. This has led to a dramatic shift in cancer treatment from using cytotoxic chemotherapy to patient specific biomarker-driven therapeutic approaches, resulting in significantly improved survival and considerable reduction in systemic side-effects. The implementation of precision medicine relies on the availability of a tumor sample for actionable biomarker profiling. In many circumstances, the solid tissue biopsy is not available. Thankfully for patients, liquid biopsy has become a clinically recognized sample type in cases where no alternative is available.
With the limited amount of total cfDNA and significantly lower amount of tumor derived fraction, the major factor that prevents wider use of liquid biopsies in biomarker testing is limited sensitivity of detection. The variables that affect detection sensitivity include both pre-analytical and analytical methods such as blood collection and sample processing, choice of cfDNA extraction method and end-point detection assays (NGS versus qPCR versus ddPCR). In addition, the ultimate outcome is also affected by the cancer biology itself, including cancer type, stage, and tumor location, all of which influence the amount of tumor-derived fraction in the bloodstream. For these reasons, liquid biopsy profiling is recommended as an alternative to tissue biopsy only in advanced disease when tumor burden is expected to be high enough to enable confident detection of cancer biomarkers.
This study evaluated the use of cfDNA for biomarker profiling in a clinically relevant setting and highlighted the impact that the cfDNA extraction method can have on the sensitivity of biomarker detection and ultimately on patient outcomes. From three extraction methods tested, only samples processed with Sera-Xtracta Cell-Free DNA Kit showed 100% concordance with tissue biopsy results, allowing for confirmation of the presence of EGFR driver mutation in all patients at baseline. This report further demonstrated that with the Sera-Xtracta Cell-Free DNA Kit, the same sensitivity can be achieved when using an alternative detection method (ddPCR) with an extremely high correlation in MAF between NGS and ddPCR.
Suitability of cfDNA-based analysis for monitoring disease progression is an exciting application of liquid biopsy that has no alternative in solid tissue sampling. The clinical utility of cfDNA-based analysis for spatial and temporal tracking of tumor evolution for monitoring therapy response and emergence of secondary resistance in NSCLC has been confirmed in a number of studies (4, 5, 6, 7, 8). Of the extraction methods tested, only samples processed with Sera-Xtracta Cell-Free DNA Kit allowed for unequivocal detection of driver mutations at baseline in all patients using ddPCR, as well as early detection of therapy resistance in Patient 2. The results of this study also demonstrate that monitoring tumor burden through the analysis of the primary driver mutation level correlates well with clinical manifestation of disease progression and might constitute an important early indicator of resistance before radiologically visible changes can be detected.
*For research use only.
This data is based on three independent experiments with the equal number of replicates in each experiment. All samples tested were treated equally (with the number of replicates being the same for all products tested in the comparison) and according to manufacturers’ protocol and recommendations. cfDNA extraction and ddPCR were carried out Biogazelle, Technologiepark-Zwijnaarde 82, 9052 Gent, Belgium in Feb 2020 and September-December 2020 respectively and data is held at this location. NGS library prep, NGS and data analysis were performed at Bio.be SA – groupe IPG, Avenue Georges Lemaître, 25, 6041 Gosselies, Belgium during April-July 2020 and data is held at this location.
References
- National Comprehensive Cancer Network. (2019). Metastatic Lung Cancer - NCCN. Retrieved from www.nccn.org: https://www.nccn.org/patients/guidelines/content/PDF/lung-metastatic-patient.pdf
- Majem M, Remon J. Tumor heterogeneity: evolution through space and time in EGFR mutant non small cell lung cancer patients. Transl Lung Cancer Res. 2013;2(3):226-237. doi:10.3978/j.issn.2218-6751.2013.03.09
- Hirsch FR, Scagliotti GV, Mulshine JL, et al. Lung cancer: current therapies and new targeted treatments. Lancet. 2017;389(10066):299-311. doi:10.1016/S0140-6736(16)30958-8
- Almodovar K, Iams WT, Meador CB, et al. Longitudinal Cell-Free DNA Analysis in Patients with Small Cell Lung Cancer Reveals Dynamic Insights into Treatment Efficacy and Disease Relapse. J Thorac Oncol. 2018;13(1):112-123. doi:10.1016/j.jtho.2017.09.1951
- Dagogo-Jack I, Brannon AR, Ferris LA, et al. Tracking the Evolution of Resistance to ALK Tyrosine Kinase Inhibitors through Longitudinal Analysis of Circulating Tumor DNA. JCO Precis Oncol. 2018;2018:PO.17.00160. doi:10.1200/PO.17.00160
- Horn L, Whisenant JG, Wakelee H, et al. Monitoring Therapeutic Response and Resistance: Analysis of Circulating Tumor DNA in Patients With ALK+ Lung Cancer. J Thorac Oncol. 2019;14(11):1901-1911. doi:10.1016/j.jtho.2019.08.003
- Douillard JY, Ostoros G, Cobo M, et al. Gefitinib treatment in EGFR mutated caucasian NSCLC: circulating-free tumor DNA as a surrogate for determination of EGFR status. J Thorac Oncol. 2014;9(9):1345-1353. doi:10.1097/JTO.0000000000000263
- Mok T, Wu YL, Lee JS, et al. Detection and Dynamic Changes of EGFR Mutations from Circulating Tumor DNA as a Predictor of Survival Outcomes in NSCLC Patients Treated with First-line Intercalated Erlotinib and Chemotherapy. Clin Cancer Res. 2015;21(14):3196-3203. doi:10.1158/1078-0432.CCR-14-2594