Introduction
Monoclonal antibodies (mAb) are the fastest growing subclass of biopharmaceuticals and mAb therapies and have been successfully demonstrated to treat a variety of diseases, mainly in oncology and in the autoimmune disease and infectious disease segments. They are responsible for recognition of and binding to pathogens such as parasites, bacteria, and viruses and for detecting transformed cells via recognition of tumor-associated antigens. The antibodies form an immune complex with the pathogen/antigen, which induces effector responses such as antibody-dependent cellular phagocytosis (ADCP), antibody-dependent cellular cytotoxicity (ADCC), and complement-dependent cytotoxicity (CDC) in innate immune cells through engagement with membrane-bound Fc receptors on the cell surface [ref 1, 2].
Fc receptors recognize and interact with the Fc region of the antibodies and play a critical role in the immune response.
Fc receptor binding to effector cells
Fc receptors are glycoproteins found on the surface of effector cells such as B lymphocytes, natural killer cells, macrophages, human platelets, and mast cells. When Fc receptors interact with antigen-bound antibodies and form a membrane complex, information is communicated to the innate and adaptive immune system via tyrosine-based activation and inhibition motifs (see Fig 1 below).
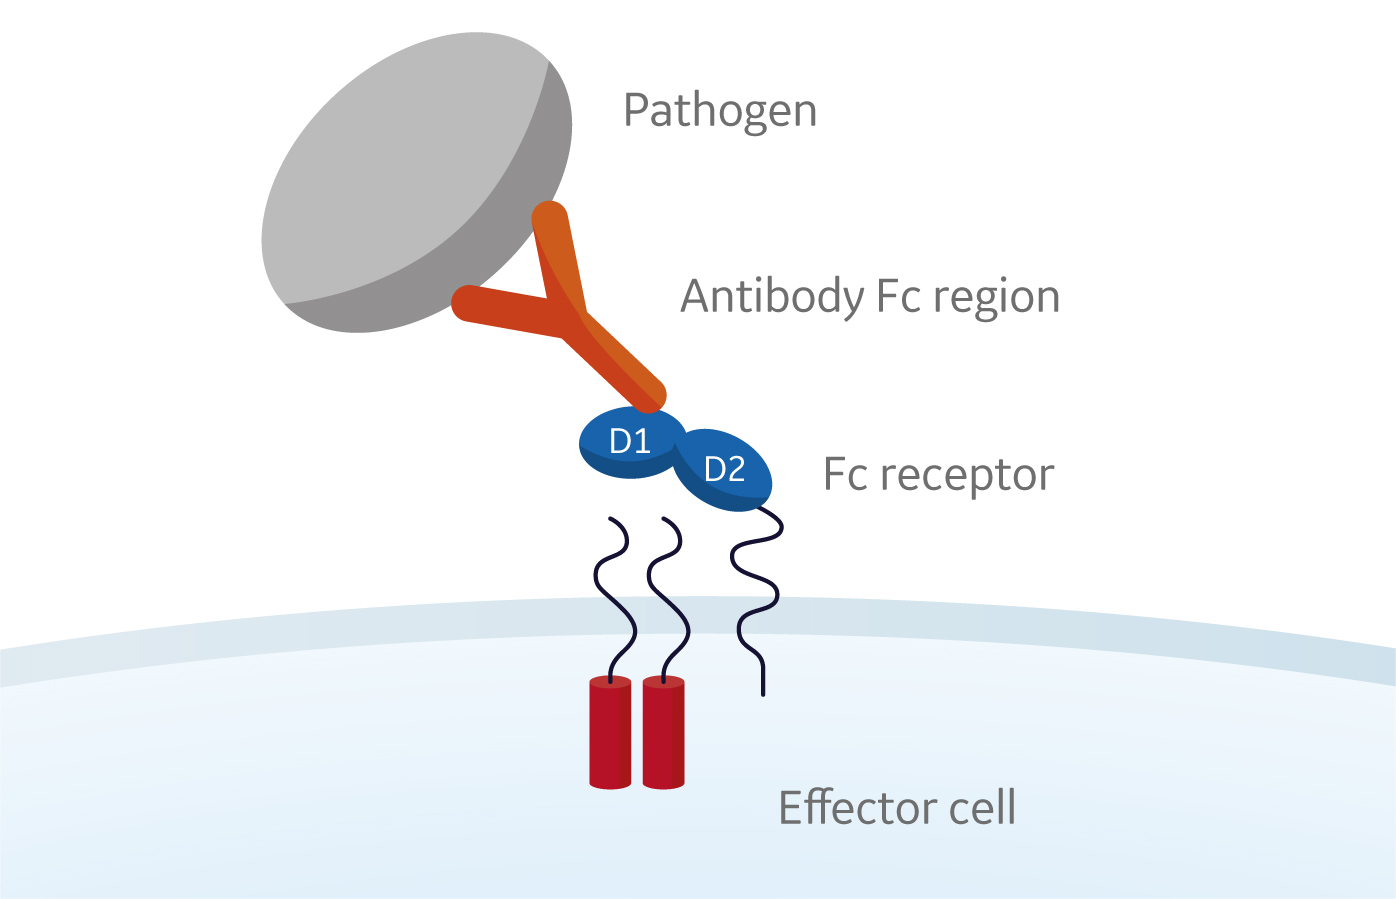
Fig 1. Interaction of Fc receptors on the cell surface of effector cells such B lymphocytes, natural killer cells, macrophages, human platelets, and mast cells with antigen-bound antibodies.
Phagocytic or cytotoxic cells are stimulated to destroy microbes, or infected cells, by antibody-dependent cell-mediated cytotoxicity. Some viruses, such as flaviviruses, also use Fc receptors to infect cells through a mechanism known as antibody-dependent enhancement of infection. Together, Fc receptors and antibodies contribute to the control of both inflammatory and anti-inflammatory responses of the innate immune system.
Fc receptors are divided into different classes based on the type of antibody they recognize:
- Fc receptors that bind to immunoglobulins or IgG antibodies are called Fc gamma receptors (FcγR).
- Fc receptors that bind IgA or IgE are called Fc alpha (Fcα) receptors and Fc epsilon (Fcε) receptors, respectively.
- Another class of Fc receptor is the neonatal Fc receptor for IgG (FcRn), which plays a major role in the transport of the immunoglobulin (antibody) IgG across epithelial barriers at mucosal surfaces and in the regulation of IgG half-life.
This document will mainly focus on Fcγ receptors. However, recommendations on assay formats and experimental setups can to a large extent be applied also to other Fc receptors.
The Fcγ receptors can be classified into three families with respect to their binding affinity for IgG.
- FcγRI (CD64) binds IgG with high binding affinity.
- FcγRIIa (CD32a) and FcγRIIIa (CD16a) are medium affinity binders.
- Low-affinity binding is seen for FcγRIIb (CD32b) and FcγRIIIb (CD16b).
Critical quality attributes (CQA), such as Fc receptor binding, are important for the safety and efficacy of a biopharmaceutical drug and monitoring of Fc receptor binding is crucial.
IgG-FcγR binding mechanisms have been the subject of multiple studies. However, reported affinities of the same IgG-FcγR interaction may differ as much as
10-fold depending on the source of the reagents and the experimental setups. There is also lack of consensus concerning optimal assay setup and assessment of data. In addition, there is significant heterogeneity found in both Fcγ receptors and antibodies due to glycosylation which adds to the complexity in analyzing the kinetics of the interactions [ref 2].
The purpose of this document is to describe how to set up, run and evaluate Fcγ receptor assays on Biacore systems in order to establish standardized guidelines.
Tips for Fc receptor binding assays
- Choose assay format depending on your needs and preferences.
- Choose antibody as ligand if the active concentration of your antibodies is unknown.
- Choose Fcγ receptor as ligand when there is low availability of receptors.
- Choose a capture format over direct coupling as this will result in higher repeatability and a more stable assay.
- Check for nonspecific binding from the sample matrix by injecting blank samples (sample matrix without antibody) and check for binding to both the active and reference surfaces.
- Establish that the assay is suitable for purpose using a few samples and well characterized control samples, characterized by orthogonal means, before you start extended runs with many samples.
- Prepare samples in running buffer to minimize bulk shift differences between sample and running buffer.
- When working with low concentration antibodies, care must be taken that the carryover of excipients does not cause RI effects. Spin columns or dialysis should be used for preparation of such samples.
- Consider using SPR sensorgram comparison (available for Biacore T200) when facing heterogeneity.
- Include the reference sample as a control when you are using sensorgram comparison to ensure consistency of the assay.
Assay formats
Assays for analyzing Fcγ receptor-antibody interactions can be set up in different orientations:
- Fcγ receptor as ligand and the antibody injected as analyte
- Antibody as ligand and the Fcγ receptor injected as analyte
Regardless of assay orientation, capture of either the antibody or FcγR is the preferred method. Direct coupling of Fcγ receptor or the antibody to the sensor chip surface has been known to result in poor inter- and intra-assay reproducibility. In addition, a capture approach omits the need for optimization of immobilization and regeneration conditions. These time-consuming steps would need to be performed for each receptor/antibody combination.
Fc gamma receptor as ligand
The main recommendation for Fcγ receptors is to use capture. A method that has proved to work well is to capture the receptors via histidine (His) tag to an anti-His antibody covalently coupled to Sensor Chip CM5. After coupling, the Fcγ receptor is captured to the anti-His antibody. Concentration series of the antibodies are then run over the captured receptor. This approach can be used with either a single cycle or a multicycle kinetics setup.
An alternative capture method is to use biotinylated Fcγ receptors and capture to Sensor Chip CAP from Biotin CAPture Kit. Capture to Sensor Chip SA is also an alternative. N.B. Capture of Fcγ receptor to Sensor Chip SA is not regenerable.
Assay formats using Fc receptors as ligands are beneficial when there is low availability of receptors but requires that the active concentration of the antibodies is known to be able to assess kinetics and affinity of the interaction.
Antibody as ligand
There are several ways to capture the antibodies to a sensor chip for analysis of Fcγ receptor binding. One approach that works for all Fcγ receptors is to biotinylate the antibodies and capture them on Sensor Chip CAP from Biotin CAPture Kit, available from Cytiva.
An alternative is to capture the antibodies to an anti-Fab surface using Human Fab Capture Kit. This product should, however, be avoided for FcγRI as this receptor is known to bind nonspecifically to the anti-Fab surface.
Sensor Chip Protein A is also known to work well for Fcγ receptor assays.
After capture of the antibody, concentration series of the Fcγ receptors are injected using either single cycle or multicycle kinetics setup. Assay formats using antibodies as ligands are suitable when there is high supply of Fcγ receptors as this format requires large amounts of Fcγ receptor. An advantage with this format is that the antibody concentration does not need to be known for assessment of kinetics and affinity. However, a suitable capture level must be determined in advance to ensure precise inter-assay variables.
Running buffer
Phosphate or HEPES saline buffers, such as PBS-P+, HBS-P+ and HBS-EP+ are recommended as running and sample dilution buffers.
Sensor chip surface preparation
For capture assays, the recommendation is to immobilize approximately 5000 RU of the capture molecule. Ready-to-use capture kits are available (see Table 1 and Table 2 below). These kits come with suggested immobilization and run condition protocols and, thus, reduce the need for immobilization, regeneration, and buffer optimization.
Table 1. Products for capture of Fcγ receptors
| Product | Specific to |
| His Capture Kit | Histidine tagged molecules |
| Biotin CAPture Kit | Reversible capture of biotinylated molecules |
| Sensor Chip SA | Permanent capture of biotinylated molecules |
Table 2. Products for capture of antibodies
| Product | Specific to |
| Biotin CAPture Kit | Reversible capture of biotinylated molecules |
| Human Fab Capture Kit | Human Fab fragments (kappa and lambda) |
| Sensor Chip Protein A | Antibodies according to the binding profile of Protein A |
Sample preparation
Prepare the samples in the same buffer as the running buffer to minimize any bulk shift differences between sample and running buffer. It is important here to ensure that consideration has been given the excipients in the antibody or FcγR buffers as cyclics such as sucrose, histidine, trehalose are known to absorb in the spectrum used by Biacore SPR systems.
SPR binding assay temperature
Default sample compartment and run temperature for Fcγ receptor assays run on Biacore systems is 25°C. To conserve sensitive samples the sample compartment temperature can be set to 15°C or lower.
Biacore run setup
Fc gamma receptor as ligand
The general approach for assays using Fcγ receptor as ligand is described below using two different capture products: His Capture Kit and Biotin CAPture Kit. In all cases, it is highly recommended that the instruction manual supplied in the kit is read and understood before starting.
| Step | Action |
| 1 | Immobilize the anti-histidine antibody1 on Sensor Chip CM5. Perform the immobilization in both active and reference flow cells. Alternatively dock Sensor Chip CAP and inject Biotin CAP Reagent on active and reference flow cells2. |
| 2 | Run conditioning according to Instructions (Biotin CAPture Kit only). |
| 3 | Run at least three startup cycles to equilibrate the system. Include Fcγ receptor in the capture step (active surface only) and antibody replaced with buffer in the analyte step (reference and active surface). Ensure that regeneration solutions used during sample testing are included in the start-up cycles. |
| 4 | Capture Fcγ receptor on the active surface. |
| 5 | Inject a concentration series of the antibody over both active and reference surfaces. Include blank cycle(s). |
| 6 | Perform a regeneration1 of the surface. |
| 7 | Evaluate the results. |
2 = See Instructions for Biotin CAPture Kit
Conditions using His Capture Kit
Recommendations for assays using Fcγ receptor as ligand with His Capture Kit are listed in Table 3.
Table 3. Recommendations for assays using Fcγ receptor as ligand with His Capture Kit
| Parameter | Recommended value | Comments |
| Immobilization capture molecule | ||
| Immobilization level | ~ 5000 RU | Use conditions specified in Instructions for His Capture Kit |
| Sensor surface | Sensor Chip CM5 | |
| Capture injection (Fcγ receptor) | ||
| Capture level | 70–100 RU for kinetics 300–400 RU for affinity | Active flow cell only |
| Concentration | 0.1–0.5 µg/mL | |
| Flow rate | 5 µL/min | To minimize reagent consumption |
| Contact time | 60–180 s | |
| Pooling | Yes | Capture solution can be pooled to minimize consumption |
| Molecular weight | N/A | Not needed in run method |
| Analyte injection (antibody) | ||
| Flow rate | 30 µL/min | To minimize mass transport effects |
| Contact time | 60 s | |
| Dissociation time | ≤ 600 s | Shorter dissociation time required for low-affinity interactions |
| Pooling | No | Pooling is not recommended for analyte injections |
| Molecular weight | Required if analyte concentrations are in weight units | Molar analyte concentrations required for evaluation of association rate constants |
| Antibody concentrations | FcRI: 1–300 nM FcRIIIa: 25–2000 nM Other FcR: 0.5–8 µM | Use molar units |
| Number of analyte concentrations | Typically 5–9 | |
| Startup cycles | ≥ 3 | Sufficient to stabilize the surface |
| Regeneration | ||
| Flow rate | 30 µL/min | |
| Solution | 10 mM Glycine, pH 1.5 | |
| Contact time | 60 s | |
Conditions using Biotin CAPture Kit
Recommendations for assays using Fcγ receptor as ligand with Biotin CAPture Kit are listed in Table 4.
Table 4. Recommendations for assays using Fcγ receptor as ligand with Biotin CAPture Kit
| Parameter | Recommended value | Comments |
| Conditioning | ||
| Flow rate | 10 µL/min | |
| Solution | 6 M Guanidine-hydrochloride/250 mM NaOH | |
| Contact time | 3 × 60 s | |
| Injection of Biotin CAPture Reagent | ||
| Sensor surface | Sensor Chip CAP | |
| Response level | 2500–5000 RU | Use conditions specified in Instructions for Biotin CAPture Kit |
| Flow rate | 2 µL/min | In order to minimize consumption |
| Contact time | 300 s | |
| Capture injection (Fcγ receptor) | ||
| Capture level | 70–180 RU for kinetics 300–400 RU for affinity | Active flow cell only |
| Concentration | 0.1–0.5 µg/mL | |
| Flow rate | 5 µL/min | To minimize reagent consumption |
| Contact time | 60–180 s | |
| Pooling | Yes | Capture solution can be pooled to minimize consumption |
| Molecular weight | N/A | Not needed in run method |
| Analyte injection (antibody) | ||
| Flow rate | 30 µL/min | To minimize mass transport effects |
| Contact time | 60 s | |
| Dissociation time | ≤ 600 s | Shorter dissociation time required for low-affinity interactions |
| Pooling | No | Pooling is not recommended for analyte injections |
| Molecular weight | Required if analyte concentrations are in weight units | Molar analyte concentrations required for evaluation of association rate constants |
| Antibody concentrations | FcRI: 1–300 nM FcRIIIa: 25–2000 nM Other FcR: 0.5–8 µM | Use molar units |
| Number of analyte concentrations | Typically 5-9 | |
| Startup cycles | ≥ 3 | Sufficient to stabilize the surface |
| Regeneration | ||
| Flow rate | 30 µL/min | |
| Solution | 6 M Guanidine-hydrochloride/250 mM NaOH | |
| Contact time | 60 s | |
Antibody as ligand
The general approach for assays using antibody as ligand is described below using three different capture products, Biotin CAPture Kit, Human Fab Capture Kit, and Sensor Chip Protein A. It is highly recommended that the instruction manual supplied in the kit is read and understood before starting.
| Step | Action |
| 1 | Dock Sensor Chip CAP in your Biacore instrument and inject Biotin CAP Reagent on active and reference flow cells1. For Human Fab Capture Kit, immobilize Human Fab Binder in active and reference flow cells according to instructions2. Alternatively dock Sensor Chip Protein A3. |
| 2 | Run conditioning according to Instructions (Biotin CAPture Kit only). |
| 3 | Run at least three startup cycles to equilibrate the system. Include Fcγ receptor in the capture step (active surface only) and antibody replaced with buffer in the analyte step (reference and active surface). Ensure that regeneration solutions that are to be used during sample testing are included in the startup cycles. |
| 4 | Capture antibody on the active surface. |
| 5 | Inject a concentration series of the Fcγ receptor over both active and reference surfaces. Include blank cycle(s). |
| 6 | Perform a regeneration1 of the surface. |
| 7 | Evaluate the results. |
2 = See Instructions for Human Fab Capture Kit
3 = See Instructions for Sensor Chip Protein A
Conditions using Biotin CAPture Kit
Recommendations for assays using antibodies as ligand with Biotin CAPture Kit are listed in Table 5.
Table 5. Recommendations for assays using antibodies as ligand with Biotin CAPture Kit
| Parameter | Recommended value | Comments |
| Conditioning | ||
| Flow rate | 10 µL/min | |
| Solution | 6 M Guanidine-hydrochloride/250 mM NaOH | |
| Contact time | 3 × 60 s | |
| Injection of Biotin CAPture Reagent | ||
| Sensor surface | Sensor Chip CAP | |
| Response level | 2500–5000 RU | Use conditions specified in Instructions for Biotin CAPture Kit |
| Flow rate | 2 µL/min | In order to minimize consumption |
| Contact time | 300 s | |
| Capture injection (antibody) | ||
| Capture level | 200–400 RU for kinetics 900–1200 RU for affinity | Active flow cell only |
| Concentration | 0.1–0.5 µg/mL | |
| Flow rate | 5 µL/min | To minimize reagent consumption |
| Contact time | 60–180 s | |
| Pooling | Yes | Capture solution can be pooled to minimize consumption |
| Molecular weight | N/A | Not needed in run method |
| Analyte injection (antibody) | ||
| Flow rate | 30 µL/min | To minimize mass transport effects |
| Contact time | 60 s | |
| Dissociation time | ≤ 600 s | Shorter dissociation time required for low-affinity interactions |
| Pooling | No | Pooling is not recommended for analyte injections |
| Molecular weight | Required if analyte concentrations are in weight units | Molar analyte concentrations required for evaluation of association rate constants |
| Antibody concentrations | FcRI: 1–300 nM FcRIIIa: 25–2000 nM Other FcR: 0.5–8 µM | Use molar units |
| Number of analyte concentrations | Typically 5–9 | |
| Startup cycles | ≥ 3 | Sufficient to stabilize the surface |
| Regeneration | ||
| Flow rate | 30 µL/min | |
| Solution | 6 M Guanidine-hydrochloride/250 mM NaOH | |
| Contact time | 60 s | |
Conditions using Human Fab Capture Kit
Recommendations for assays using antibodies as ligand with Human Fab Capture Kit are listed below in Table 6.
Table 6. Recommendations for assays using antibodies as ligand with Human Fab Capture Kit
| Parameter | Recommended value | Comments |
| Immobilization capture molecule | ||
| Immobilization level | 5000 RU | Use conditions specified in Instructions for Human Fab Capture Kit1 |
| Sensor surface | Sensor Chip CM5 | |
| Capture injection (antibody) | ||
| Capture level | 200–400 RU for kinetics 900–1200 RU for affinity | Active flow cell only |
| Concentration | 0.1–0.5 µg/mL | |
| Flow rate | 5 µL/min | To minimize reagent consumption |
| Contact time | 60–180 s | |
| Pooling | Yes | Capture solution can be pooled to minimize consumption |
| Molecular weight | N/A | Not needed in run method |
| Analyte injection (Fcγ receptor) | ||
| Flow rate | 30 µL/min | To minimize mass transport effects |
| Contact time | 60 s | |
| Dissociation time | ≤ 600 s | Shorter dissociation time required for low affinity interactions |
| Pooling | No | Pooling is not recommended for analyte injections |
| Molecular weight | Required if analyte concentrations are in weight units | Molar analyte concentrations required for evaluation of association rate constants |
| Antibody concentrations | FcRI: 1–300 nM FcRIIIa: 25–2000 nM Other FcR: 0.5–8 µM | Use molar units |
| Number of analyte concentrations | Typically 5–9 | |
| Startup cycles | ≥ 3 | Sufficient to stabilize the surface |
| Regeneration | ||
| Flow rate | 30 µL/min | |
| Solution | 10 mM Glycine, pH 2.1 | |
| Contact time | 2 × 60 s | |
Conditions using Sensor Chip Protein A
Recommendations for assays using antibodies as ligand with Sensor Chip Protein A are listed in Table 7.
Table 7. Recommendations for assays using antibodies as ligand with Sensor Chip Protein A
| Parameter | Recommended value | Comments |
| Immobilization capture molecule | ||
| Immobilization level | N/A | Prefunctionalized surface |
| Sensor surface | Sensor Chip Protein A | |
| Capture injection (antibody) | ||
| Capture level | 200–400 RU for kinetics 900–1200 RU for affinity | |
| Concentration | 0.1–0.5 µg/mL | |
| Flow rate | 5 µL/min | To minimize reagent consumption |
| Contact time | 60–180 s | |
| Pooling | Yes | Antibody solution for capture can be pooled to minimize consumption |
| Molecular weight | N/A | Not needed in run method |
| Analyte injection (Fcγ receptor) | ||
| Flow rate | 30 µL/min | To minimize mass transport effects |
| Contact time | 60 s | |
| Dissociation time | ≤ 600 s | Shorter dissociation time required for low affinity interactions |
| Pooling | No | Pooling is not recommended for analyte injections |
| Molecular weight | Required if analyte concentrations are in weight units | Molar analyte concentrations required for evaluation of association rate constants |
| Fc receptor concentrations | FcRI: 1–300 nM FcRIIIa: 25–2000 nM Other FcR: 0.5–8 µM | Use molar units |
| Number of analyte concentrations | Typically 5–9 | |
| Startup cycles | 1 to 3 | Sufficient to stabilize the surface |
| Regeneration | ||
| Flow rate | 30 µL/min | |
| Solution | 10 mM Glycine, pH 1.5 | |
| Contact time | 30 s | |
Evaluation tools and options
Results from Fcγ receptor analysis are often reported as affinity data. Kinetic data is less common due to heterogeneity of the interactants. For example, it has been shown that the glycosylation state of both antibody and FcγR1 (CD64) has a direct impact on the kinetics [ref 2]. Thus, kinetics becomes very complex and kinetic and affinity constants cannot always be reliably determined, only estimated.
Evaluation of binding kinetics and steady-state affinity
Estimates of kinetics and/or affinity constants from Fcγ receptor experiments data can be obtained using standard procedure for kinetics and affinity assessment. For detailed information, see Biacore Application Guide Kinetics and affinity measurements with Biacore systems [ref 3].
Evaluation using sensorgram comparison with Biacore T200
FcγR-antibody interactions can also be evaluated using sensorgram comparison available on Biacore T200. Sensorgram comparison is a statistical approach that uses the full binding profile and compares the shape of the binding curve with that of a reference sample [ref 4]. Sensorgram comparison is setup as a standard kinetics experiment but does not involve fitting of the curve.
As in any kinetic experiment, the data set needs to contain kinetic information to enable use of sensorgram comparison, that is, there should be curvature and a visible dissociation (> 5%). The procedure for Fcγ receptor analysis using sensorgram comparison is described below.
Establishing experimental variation of the reference sample
The first step when working with sensorgram comparison is to establish the experimental variation of the reference. This is performed by running experiments on different dates, with different preparations of the reagents and, if possible, with different operators and instruments. Data can also come from different batches of the reference sample. This will reveal the natural variation of the reference sample. The example below shows repeated runs of Rituximab binding to FcγRIIIa V158.
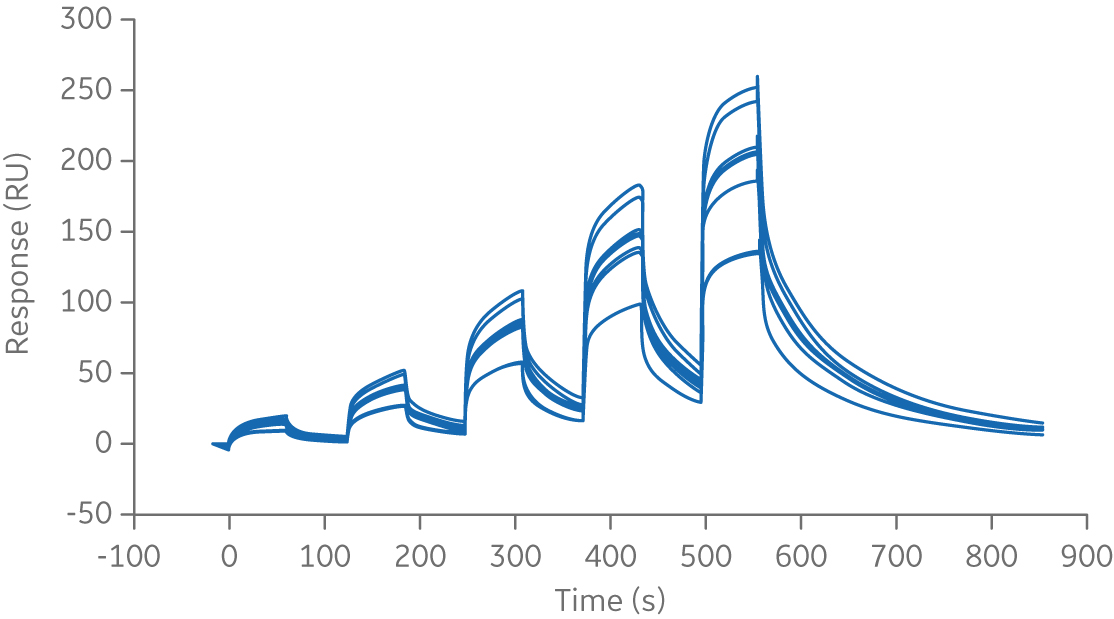
Fig 2. Sensorgram of repeated runs of the chimeric monoclonal antibody biotherapeutic, Rituximab, binding to FcγRIIIa V158 ligand.
The references samples are collated and globally normalized to compensate for inter- assay variability in capture/immobilization level. Data is displayed on a normalized scale of 0 to 1000 as seen in the figure below.
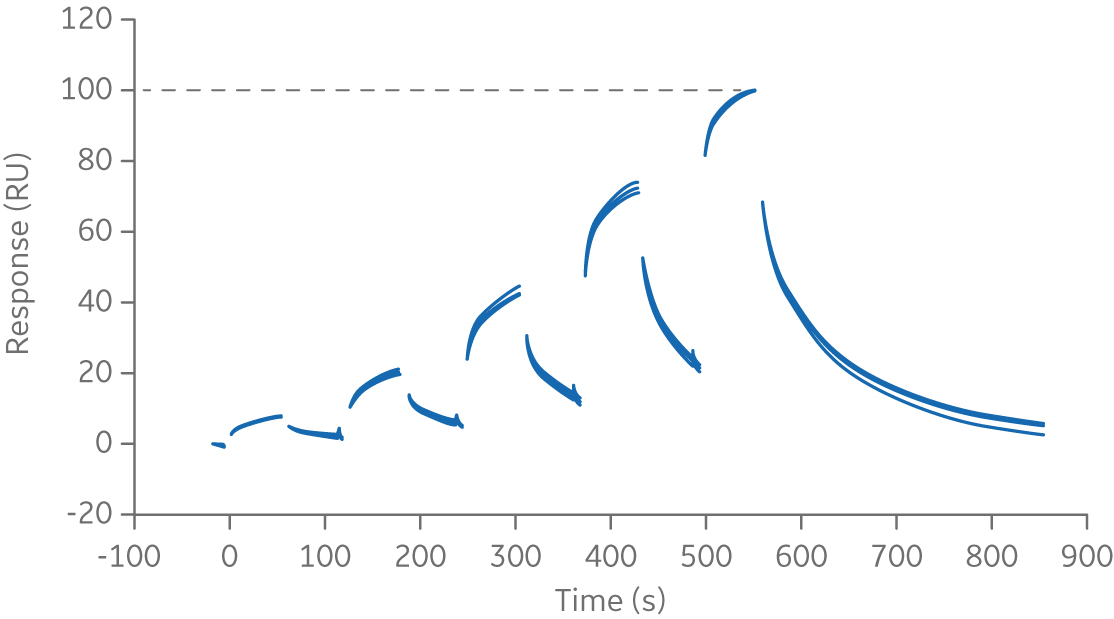
Fig 3. Normalized sensorgram of chimeric monoclonal antibody biotherapeutic, Rituximab, binding to FcγRIIIa.
From this data, an average curve is calculated. In this example, three standard deviations were applied to the experimental data (upper and lower curve in figure below). This is used to calculate a comparison window (see lower figure below). Samples with similar curve shapes, and thus similar kinetics, are expected to fall within this window. Comparison can be made using the entire binding curve or association/dissociation only.
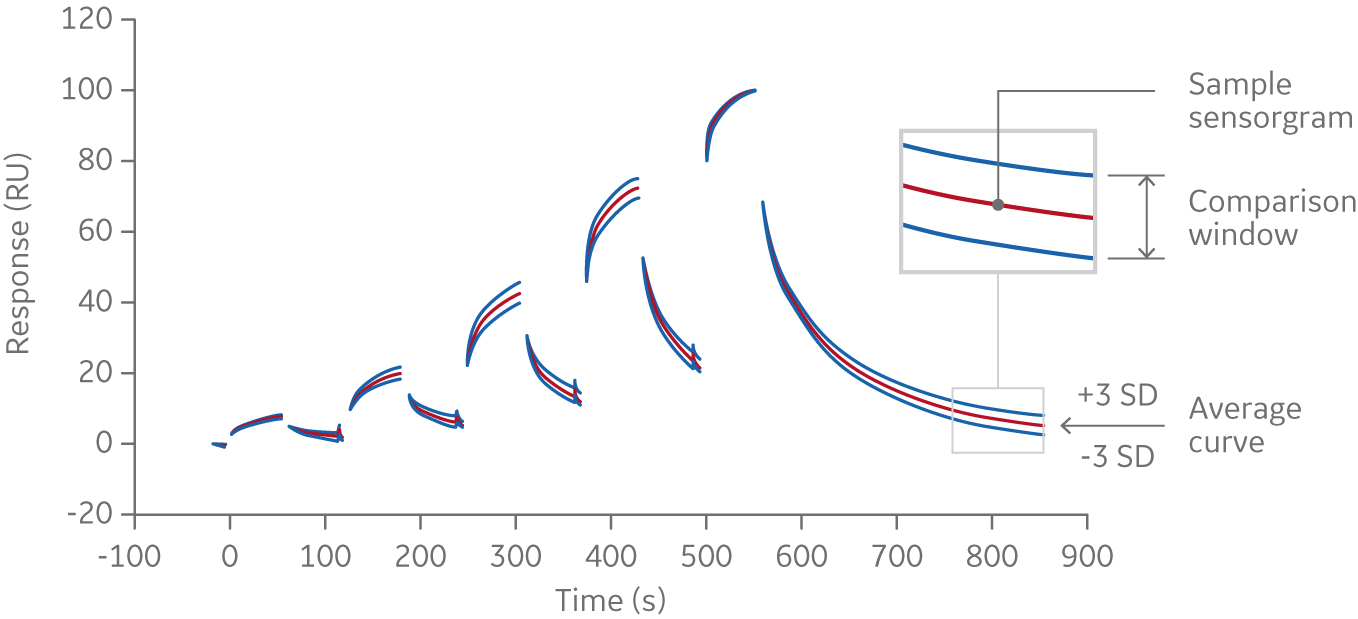
Fig 4. Average sensorgram curve from which a comparison window is calculated; samples with similar curve shapes, and thus similar kinetics, are expected to fall within this window.
Assessment of similarity
Samples are run using the same settings as for the reference sample. The similarity of the interactions is quantitated by a similarity score (0% to 100%), which is calculated from the number of data points within and outside of the comparison window. A sample with all data points within the comparison window will have a similarity score of 100% while a sample with data points outside the comparison window will have a similarity score less than 100%.
The example below shows three antibodies binding to FcγRIIIa V158 (Fig 5). The reference sample in this example is Rituximab. Rituximab was also included in the experiment as a control to check consistency of the assay. As expected, all data points for the Rituximab control fall within the comparison window and the similarity score for the Rituximab control is 100% (Fig 5). The Infliximab curve (left sensorgram in Fig 5) is also relatively similar to the reference curve and the similarity score is ~ 82%. For Omalizumab and Trastuzumab (middle and right sensorgrams in Fig 5), many of the data points are outside the comparison window and consequently the similarity scores are lower (60% and 53% respectively).
For more detailed information on sensorgram comparison see [ref 5].
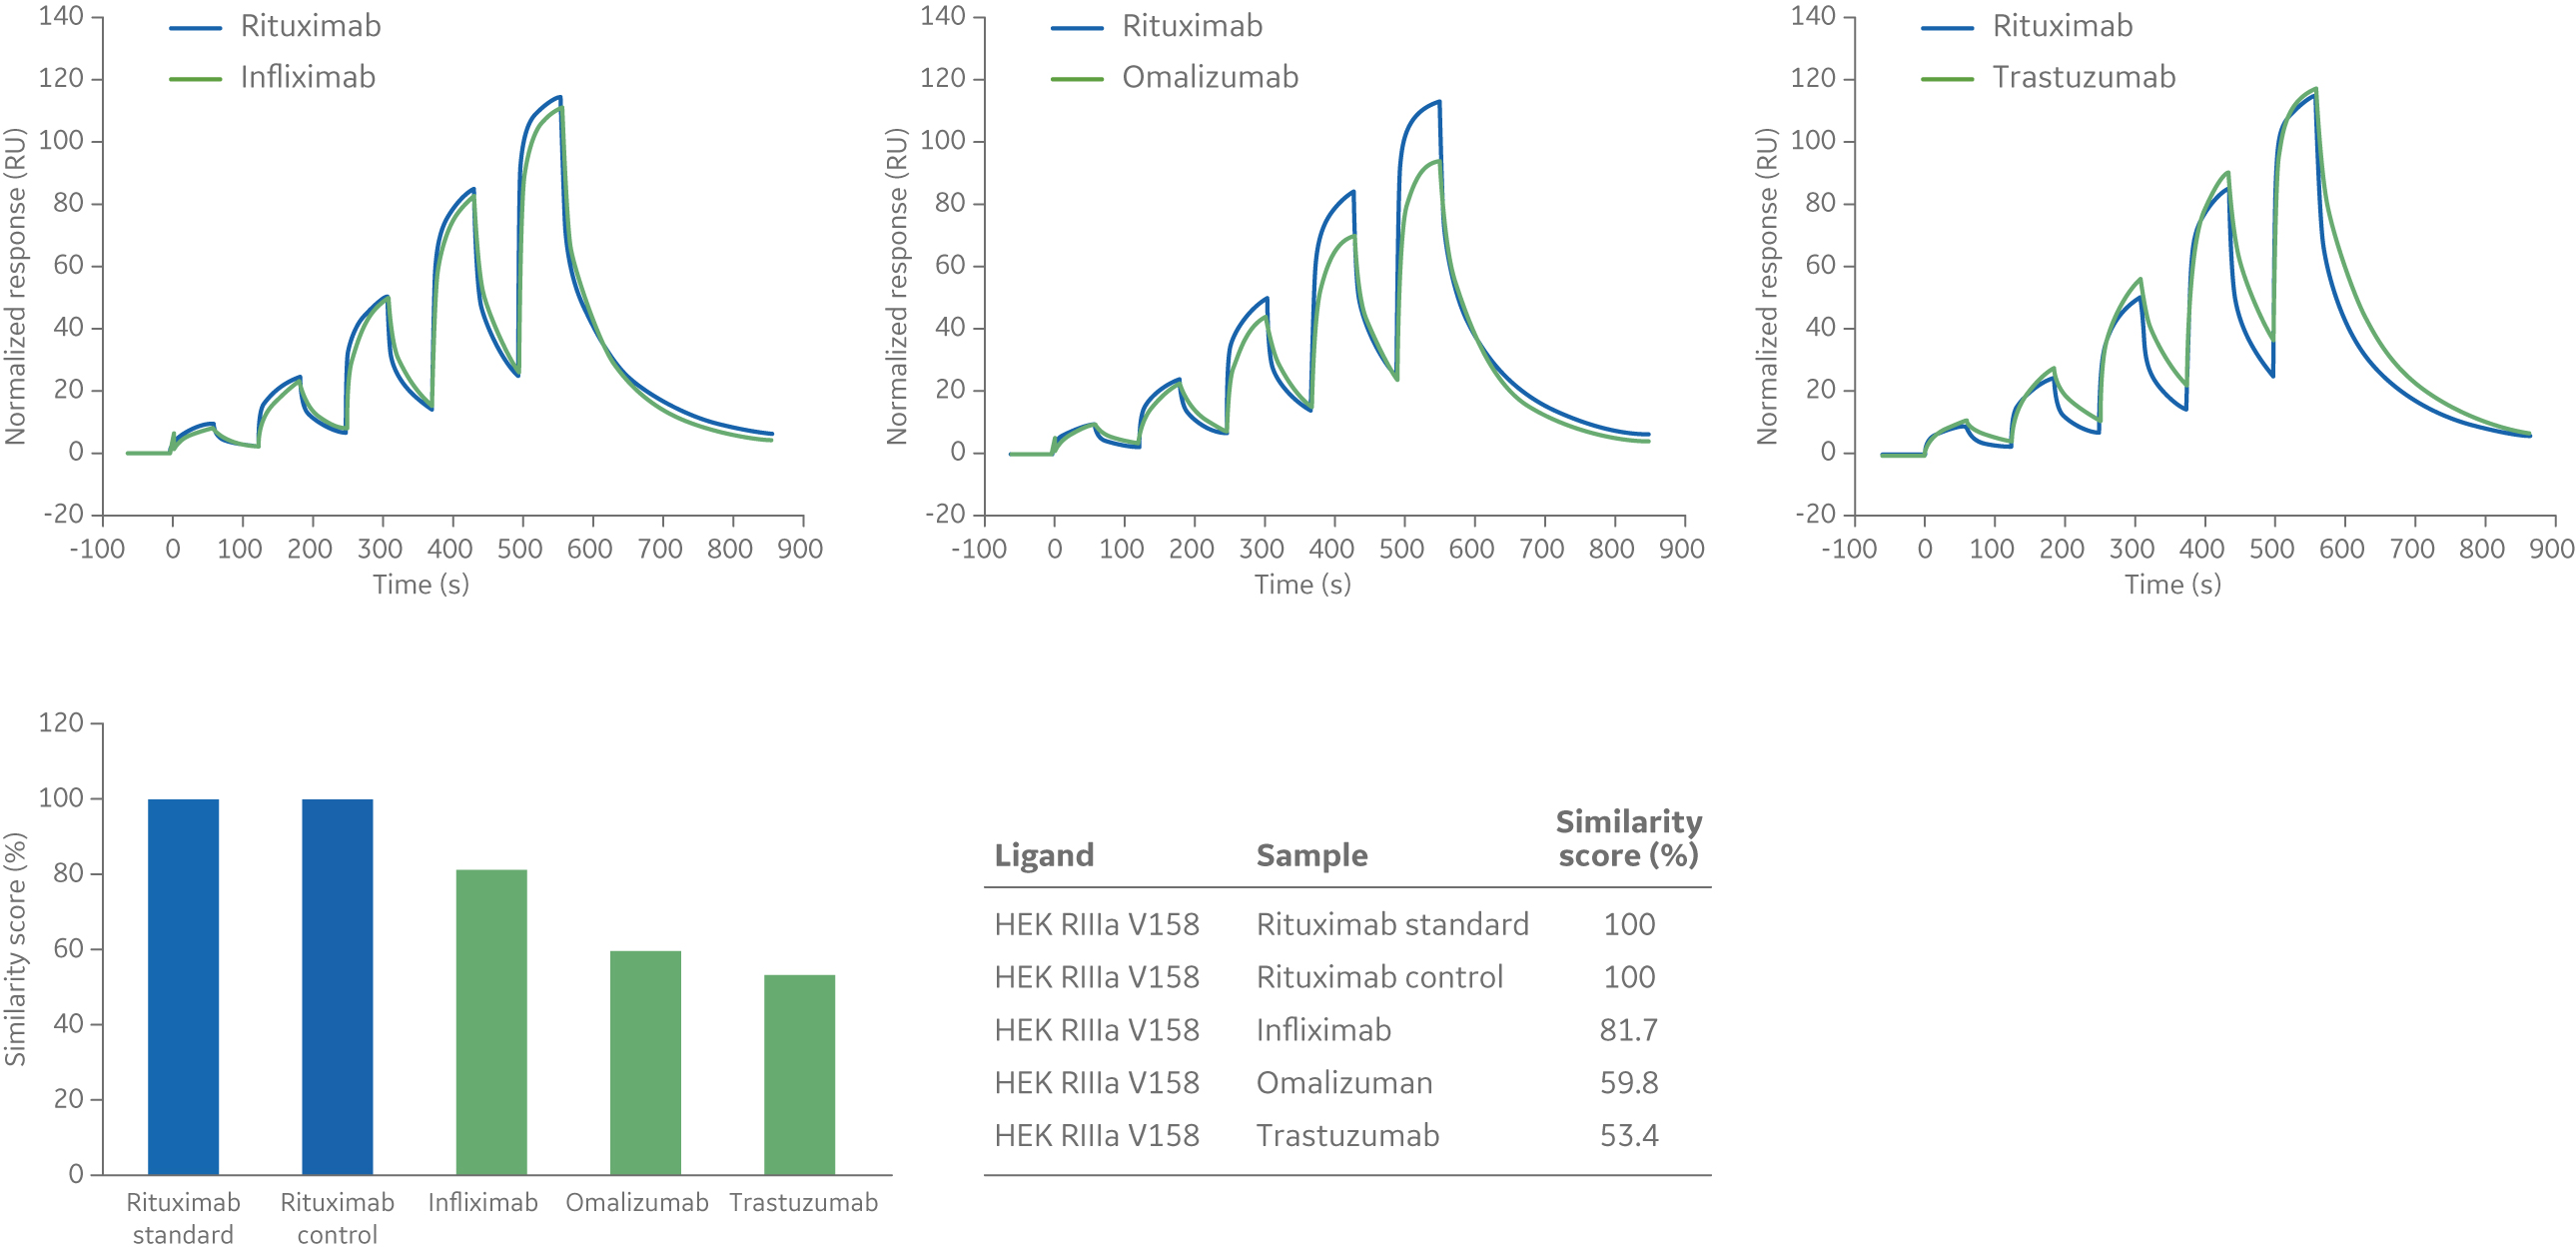
Fig 5. Sensorgrams (above) and similarity scores (below) in comparison to a Rituximab standard for the binding of three mAb biotherapeutics—Infliximab, Omalizumab, and Trastuzumab—to Fc FcγRIIIa V158 ligand.
Summary
In this document we have presented generally applicable methods for assessment of Fcγ receptor-antibody interactions using Biacore systems. The proposed methods enable experiments using the antibodies either as ligands or as analytes. However, heterogeneity in both antibodies and Fcγ receptors can hinder reliable determination of binding kinetics and binding affinity (measured by the equilibrium dissociation constant, KD) constants. An alternative evaluation approach is to use sensorgram comparison, a statistical approach that compares the entire binding profile of the samples with a reference standard as a mean to assess Fcγ receptor-antibody interactions. N.B. Sensorgram comparison is only available for Biacore T200.
Download our handbook: Fc receptor binding assays using surface plasmon resonance
References
- Hayes, J. M. et al. Identification of Fc gamma receptor glycoforms that produce differential binding kinetics for Rituximab. Mol. Cell Proteomics 16(10), 1770–1788 (2017).
- Hayes, J. M. et al. Fc gamma receptor glycosylation modulates the binding of IgG glycoforms: a requirement for stable antibody interactions. J. Proteome Res. 13(12), 5471–5485 (2014).
- Biacore Application Guides: Kinetics and affinity measurements with Biacore systems, Cytiva, 29360778
- Karlsson R. et al., Comparison of surface plasmon resonance binding curves for characterization of protein interactions and analysis of screening data, Anal. Biochem. 502, 53–63 (2016).
- Gassner C. et al. Beyond conventional dose-response curves: Sensorgram comparison in SPR allows single concentration activity and similarity assessment. J. Pharm. Biomed. Anal. 154, 57–65 (2018).