需要更高的通量和更高效的工艺开发
生物制造的趋势是单克隆抗体 (mAb) 项目的数量将增加,批量将变小,大多数 mAb 的产量低于 100 kg/年 (1)。这些趋势推动了对加快筛选更多克隆抗体和提高工艺开发 (PD) 效率的需求。当前用高通量筛选主要候选药物和优化工艺条件而纯化 mAb 的方法通常使用基于填料的层析柱和液体处理自动化设备。这种设置需要较大的占用空间和资本密集型设备。基于纤维的层析 (Fibro) 具有开孔结构,其中传质受对流的控制,而不受基于填料的层析所用扩散流的控制 (2)。使用固定化蛋白 A 配基的 Fibro 技术可在极短的停留时间下实现高 mAb 结合能力,因而循环时间只有几分钟,而基于填料的层析却需要数个小时。使用 Fibro PrismA 单元的快速循环为高通量纯化(用于筛选主要候选药物和工艺条件)提供了新的机会。
本研究评估了偶联耐碱性蛋白 A 配基 (HiTrap Fibro PrismA) 的 Fibro 单元在 ÄKTA pure 层析系统(带有随附的自动进样器)上自动进行一步和两步纯化的性能。与 HiTrap MabSelect PrismA 层析柱的性能进行了比较。对于两步方案,将捕获步骤中的洗脱液自动上样至两个串联的 5 mL HiTrap 脱盐柱上,以实现缓冲液更换,用于后续分析表征,如图 1 中所示。评估了回收率和总纯化时间以及关键产品质量属性 (PQA),包括电荷异构体、聚集体和片段含量、肽谱分析以及 N-糖基化分析。使用 MAM-MS 进行肽谱分析和 N-糖基化分析。HiTrap Fibro PrismA 单元的总运行时间大幅缩短,而两种技术的回收率和被评估的 PQA 相当。
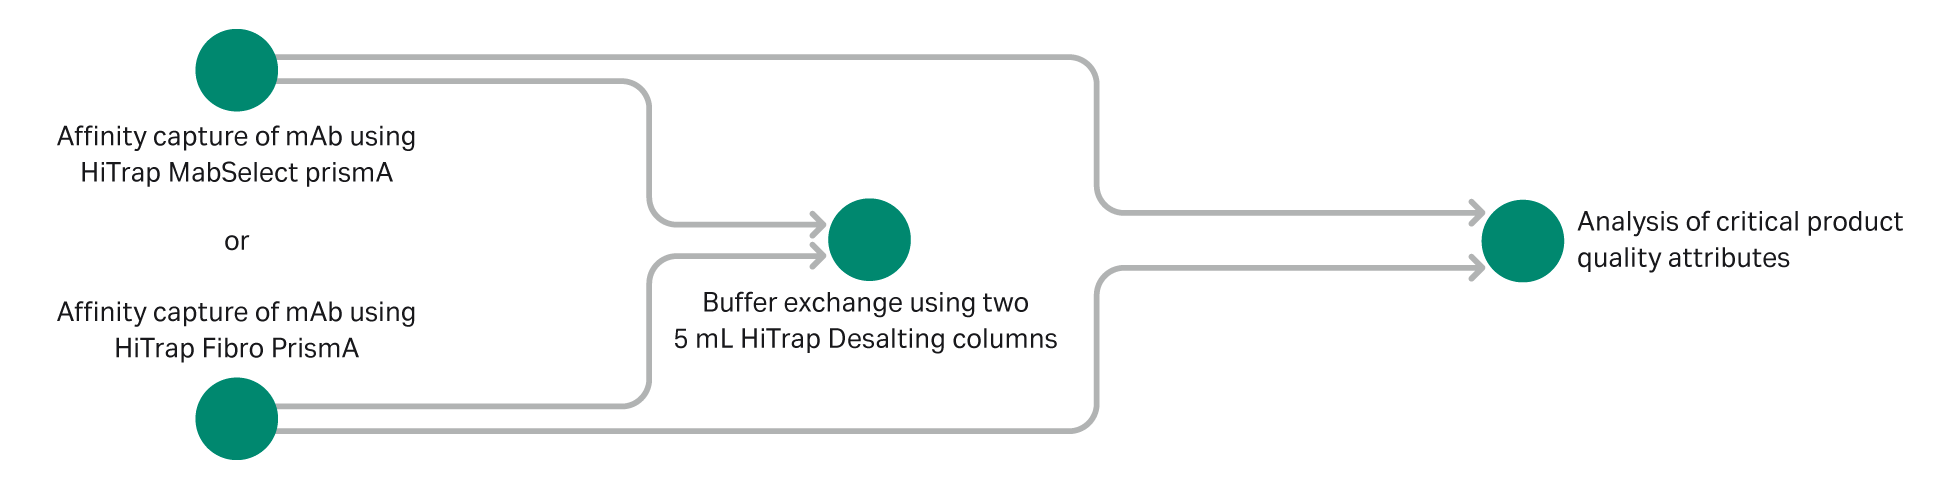
图 1. 自动一步和两步 mAb 纯化示意图。
结果
纯化时间和残留
将 ÄKTA pure 系统连接至 Teledyne™ 自动进样器并进行相关设置,以从补料分批培养第 3–12 天纯化 10 份 mAb 样品。比较了 0.4 mL HiTrap Fibro PrismA 单元和 1 mL HiTrap MabSelect PrismA 层析柱上的一步捕获纯化性能。通过 HiTrap Fibro PrismA 单元,每份样品的纯化时间从 54 分钟缩短至 10 分钟,包括在纯化两份样品间隙清洁层析柱或单元以及准备自动进样器所用的时间(约 5 分钟)。对于一步方案,使用 Fibro 总计使循环时间缩短至 1/5。参见图 2 中的层析图。
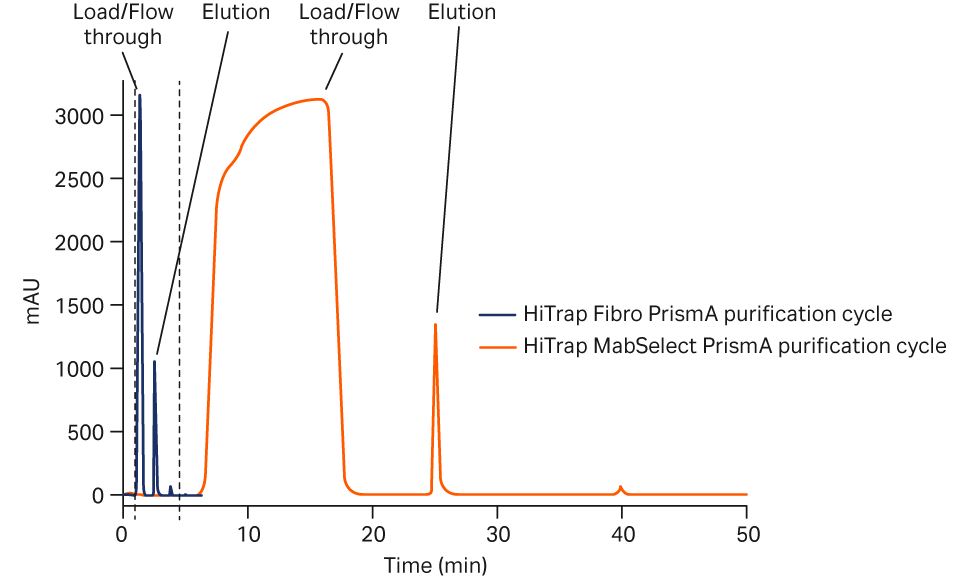
图 2. 使用 HiTrap Fibro PrismA(蓝色曲线)和 HiTrap MabSelect PrismA(橙色曲线)对 mAb 进行亲和纯化。
使用从 HiTrap Fibro PrismA 单元(直接转移至含 Sephadex G-25 填料的 2 × 5 mL HiTrap 脱盐柱)中捕获的峰设置 mAb 补料样品的自动两步串联纯化。在捕获和缓冲液更换步骤之间获得高回收率,与 HiTrap MabSelect PrismA 相比,循环时间几乎缩短至 1/4(表 1)。
表 1. 一份 mAb 样品的两步串联纯化的回收率和运行时间
| 纯化规格 | 测量亲和步骤的回收率 – UV 洗脱面积 (mL × mAU) | 测量脱盐步骤的回收率 – UV 洗脱面积 (mL × mAU) | 总运行时间,包括自动进样器管线的 CIP 和清洁 (min) |
| HiTrap MabSelect PrismA 层析柱,1 mL | 1036 | 1027 | 84 |
| HiTrap Fibro PrismA 单元,0.4 mL | 1175 | 1109 | 22 |
CIP = 原位清洁。
为了检查不同样品运行之间的残留,在蛋白 A 步骤后对空白运行进行 SDS-PAGE 分析。图 3 显示了 mAb 样品(泳道 1–7)和空白运行(泳道 8 和 9)的 SDS-PAGE 分析。在泳道 8 和 9 中未见蛋白条带,表明没有蛋白 A 步骤的残留。
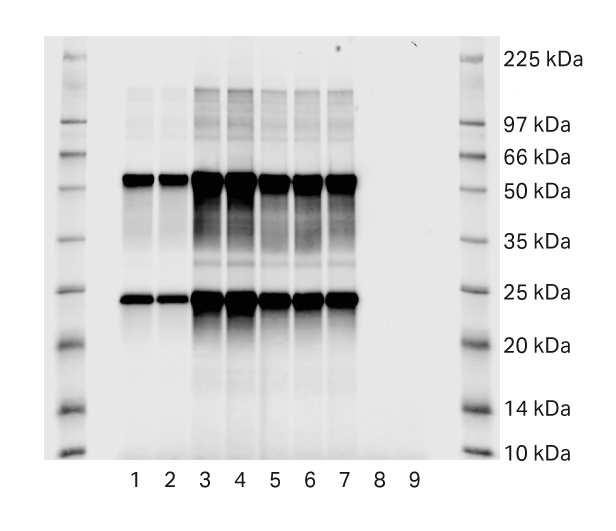
图 3. 蛋白 A 步骤后 SDS-PAGE 分析。空白运行为样品 8 和 9。
样品
- 收获前第 8 天采集并使用 HiTrap Fibro PrismA 单元纯化的 mAb 补料
- 收获前第 8 天采集并使用 HiTrap MabSelect PrismA 纯化的 mAb 补料
- 使用 HiTrap Fibro PrismA 单元纯化的收获物
- 使用 HiTrap MabSelect PrismA 纯化的收获物
- 使用 HiTrap Fibro PrismA 单元通过脱盐纯化的收获物
- 使用 HiTrap MabSelect PrismA 通过脱盐纯化的收获物
- 使用 HiTrap MabSelect PrismA 通过脱盐纯化的收获物(泳道 6 的重复样品)
- HiTrap Fibro PrismA 单元中的空白运行
- HiTrap MabSelect PrismA 中的空白运行
电荷异构体图谱
图 4 显示了使用 HiTrap Fibro PrismA 或 HiTrap MabSelect PrismA 捕获的细胞培养工艺中 mAb 电荷异构体的相对分布。Fibro 单元和层析柱之间的电荷异构体分布无重大差异。
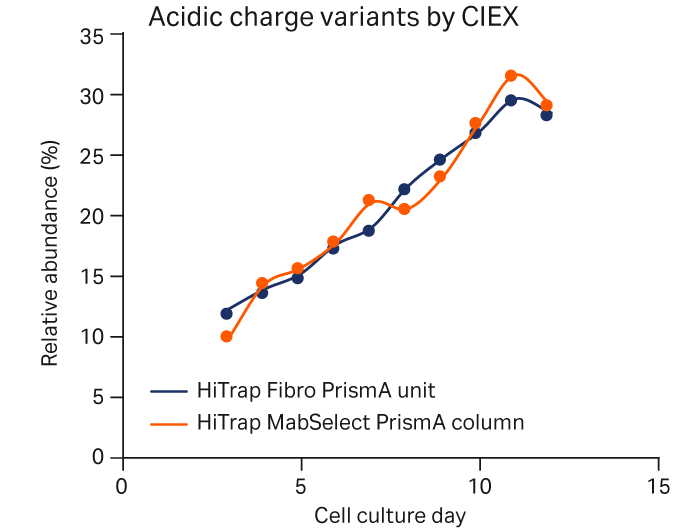
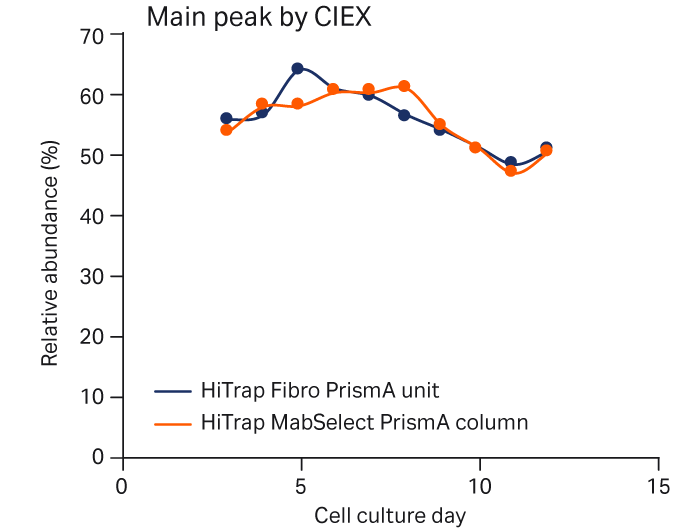
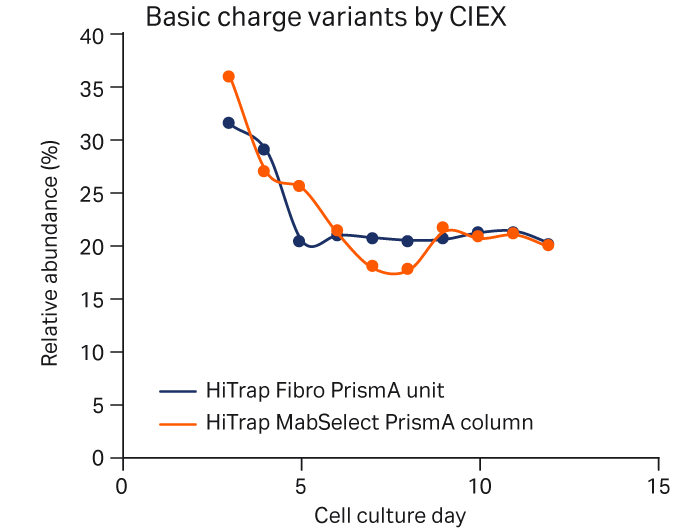
图 4. 使用 HiTrap Fibro PrismA 单元或 HiTrap MabSelect PrismA 层析柱捕获 mAb 后,补料分批培养工艺中的电荷异构体。采用阳离子交换层析法 (CEX) 进行分析。(A) 酸性峰、(B) 主峰和 (C) 碱性峰电荷异构体。
聚集体和片段图谱
图 5 提供了使用 HiTrap Fibro PrismA 或 HiTrap MabSelect PrismA 捕获的 mAb 单体、聚集体和片段在细胞培养工艺中的相对分布。可以看出,两种捕获方法中这些物质的分布无明显差异。
注意,在培养期间聚集体和片段的相对丰度未显著增加,表明生产工艺稳定。
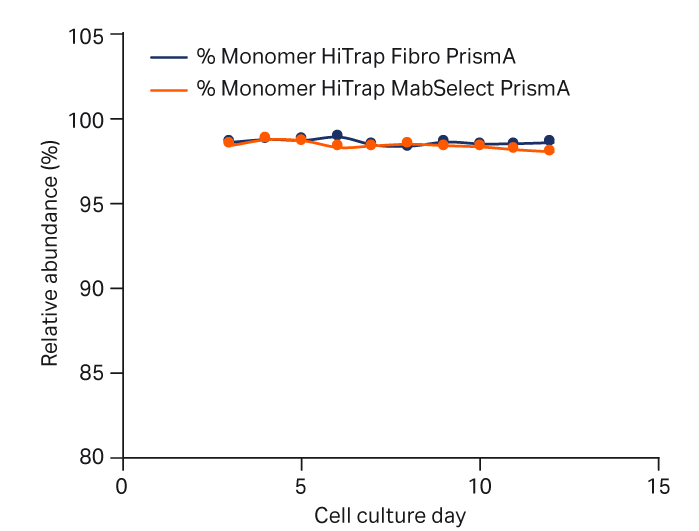
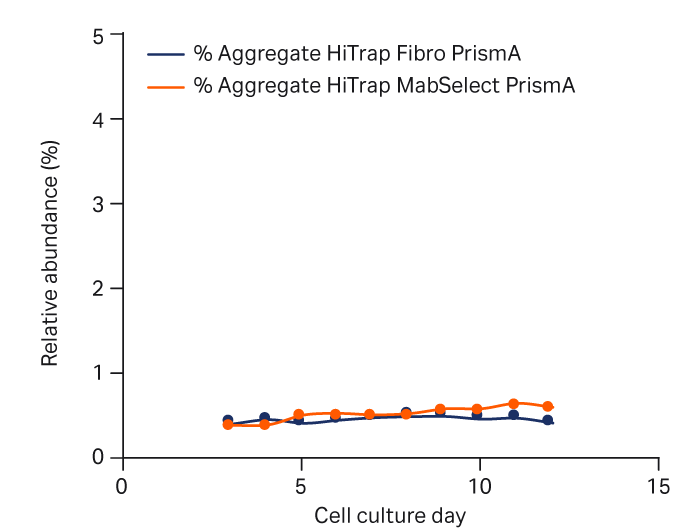
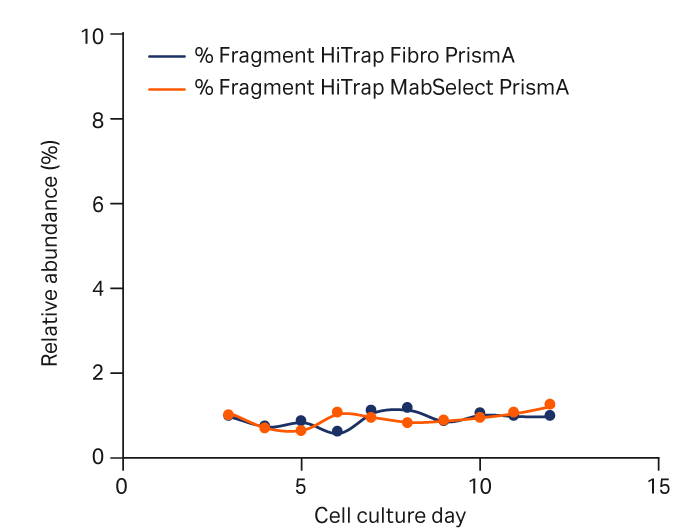
图 5. 使用 HiTrap Fibro PrismA 单元或 HiTrap MabSelect PrismA 层析柱捕获 mAb 后,补料分批培养工艺中单体、聚集体和片段的丰度。采用尺寸排阻层析法 (SEC) 进行分析。(A) 单体、(B) 聚集体和 (C) 片段。MS PrismA 为 MabSelect PrismA。
使用质谱-多属性监测分析 PQA
监测 PQA 的经典方法是对每个属性使用不同的分析方法。这相当费时,通常需要多个系统、多种耗材和方法来监测所有关键属性。最近,质谱 (MS)-多属性监测 (MAM) 已成为在一次分析中测量多种属性的替代方法 (3, 4)。此外,该方法允许进一步深入分析分子水平和发现新的重要 PQA。图 6 总结了可使用 MAM-MS 监测的 PQA。
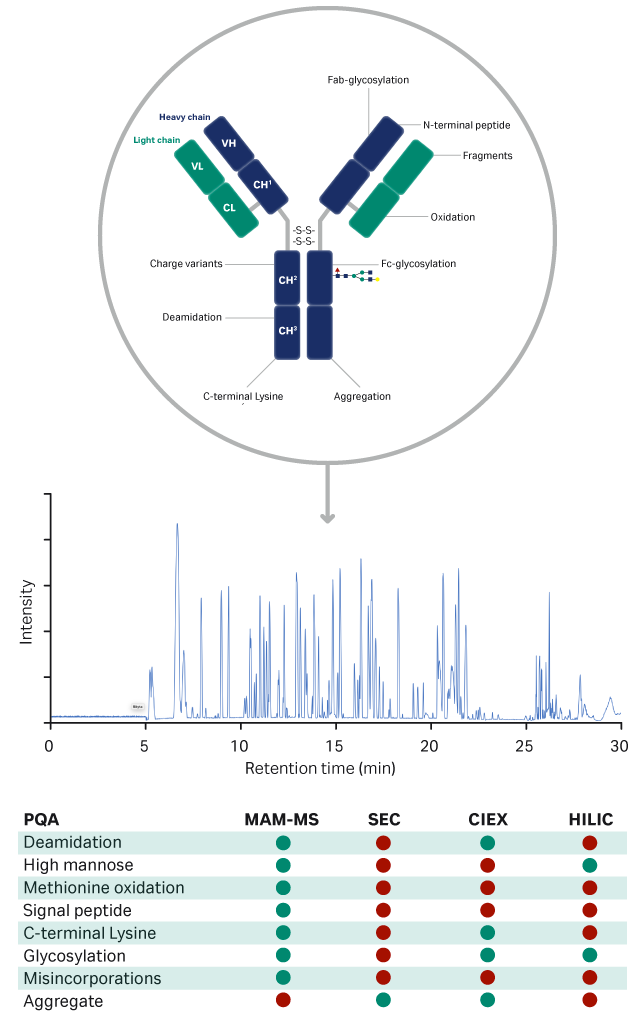
图 6. 可通过 MAM-MS 和传统层析方法监测的 PQA 概述。绿色表示可以使用该方法;红色表示不能使用。HILIC 是疏水相互作用液相层析法。
肽谱分析图
图 7 提供了使用 Fibro PrismA 或 MabSelect PrismA 捕获 mAb 后多属性监测–质谱 (MAM-MS) 分析的肽图谱。单个图谱和重叠图谱匹配,表明两种捕获方法之间无实质性差异。
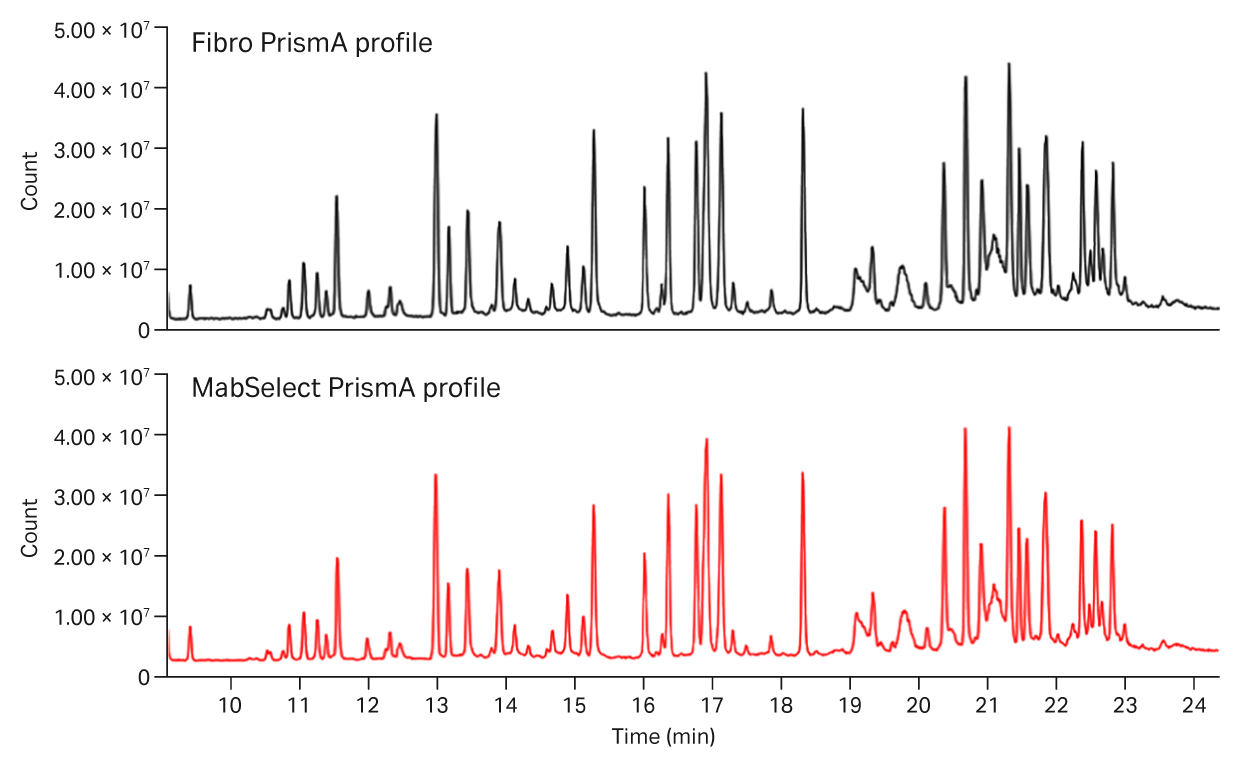
图 7. 使用 HiTrap Fibro PrismA 或 HiTrap MabSelect PrismA 捕获的细胞培养第 8 天 mAb 样品的肽图谱。
图谱相关性
在三次重复运行中,提取了图 7 层析图中最常见的 200 个特征并进行了关联。如图 8 所示,特征(肽)的丰度由圆圈大小表示。200 个特征之间完全相关,进一步表明未观察到或测量到 Fibro 单元或层析柱捕获的 mAb 之间具有差异。
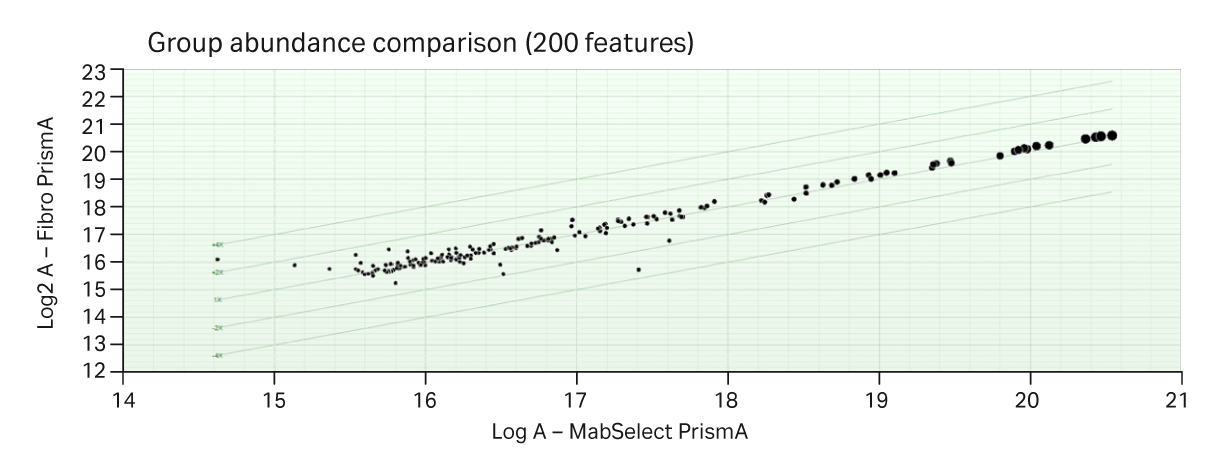
图 8. 图 7 层析图中 200 个最常见肽特征的相关性图。基于 Fibro 单元和层析柱的三次重复运行的数据。
N-糖基化比较
N-糖基化特征是最终产品非常重要的 PQA。在 CHO 细胞中表达的 IgG1 型 mAb 的主要 N-糖基化物质为 G0F 和 G1F,如图 9 所示。因此,比较了通过 Fibro 单元或层析柱捕获的 mAb 的 G0F 和 G1F 图谱。使用 Fibro 单元或层析柱捕获后,G0F 和 G1F 糖基化图谱相似。这些结果证实了这些 N-聚糖图谱具有可比性。
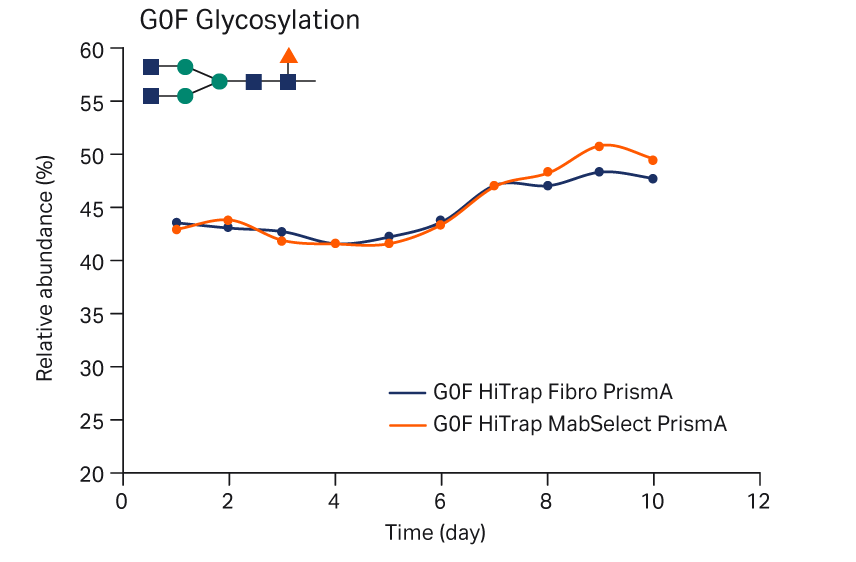
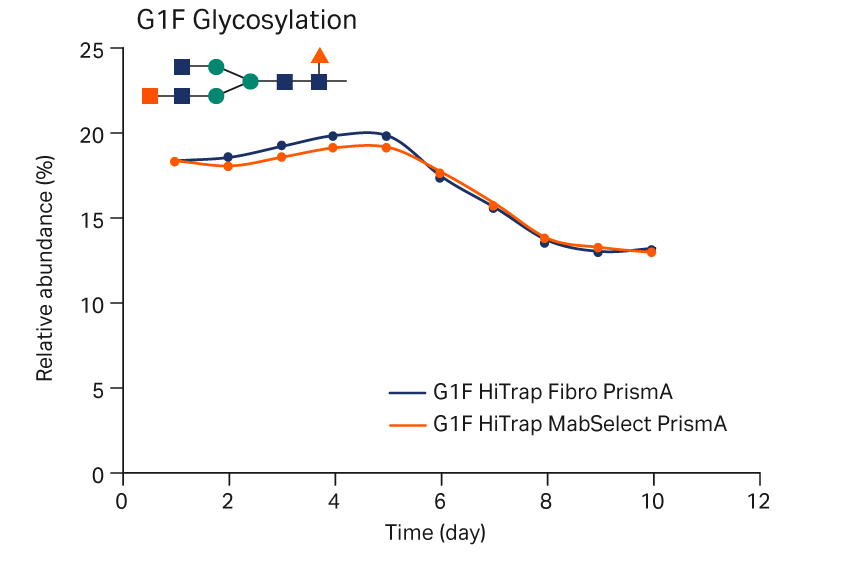
图 9. 使用 HiTrap Fibro PrismA 单元或 HiTrap MabSelect PrismA 层析柱捕获后培养期间 mAb 样品的 N-聚糖图谱。(A) G0F 和 (B) G1F 糖基化。
结论
在本研究中,使用 HiTrap Fibro PrismA 单元在 ÄKTA pure 层析系统上使用市售自动进样器自动纯化多份 mAb 补料样品。与 HiTrap MabSelect PrismA 层析柱相比,循环时间缩短,一步方案缩短至 1/5 以下,两步方案几乎缩短至 1/4。Fibro 单元和层析柱之间的回收率相近,通过对 Cy5 标记样品进行 SDS-PAGE 分析测定不同 mAb 补料的捕获之间无残留。Fibro 单元和层析柱之间的纯度相当,电荷异构体图谱相似,单体、聚集体和片段的相对丰度相似。MAM-MS 分析还提供了两种重要 N-糖基化的相当肽图谱、图谱相关性和 N-聚糖模式。
综上所述,这些结果表明,Fibro 单元具有与层析柱等效的性能,但却可以节省大量时间。使用 ÄKTA 系统上的自动进样器进行串行设置,可在高通量模式下提供完整层析图,该模式可自动纯化大量样品。该设置无需液体处理自动设备,可提高筛选 mAb 克隆的通量,并可用于上游工艺开发等应用,以优化培养条件。
致谢
感谢 Agilent Technologies UK 的 Richard Blankley 在我们创建 LC-MS/MS 方法和 MS 定量数据评估方法方面提供的帮助。还感谢 Teledyne Technologies Inc 提供 ASX-560 自动进样器,提高了我们的工作效率。
参考文献
- 数据来源于 BDO BioProcess Technology Consultants bioTRAK™ 数据库。
- 数据文件:HiTrap Fibro PrismA and HiScreen Fibro PrismA chromatography, Cytiva, CY7145-08Apr20-DF (2020)。
- Rogers R. S. et al. Development of a quantitative mass spectrometry multi-attribute method for characterization, quality control testing and disposition of biologics. MAbs 7, 881–890 (2015).
- Rogers R. S. et al. A view on the importance of multi-attribute method for measuring purity of biopharmaceuticals and improving overall control strategy.AAPS J.20, 7 (2017).
Fed-batch culture
A mAb-producing Chinese hamster ovary (CHO) cell line was cultured in shake flasks in HyClone ActiPro medium. Cultures were fed with Cell Boost 7a and 7b daily from day 3 until harvest at 87% viability on day 12. The culture was sampled daily from day 3, and cells were removed by centrifugation and filtration. Collected samples were stored at -20°C during the culture time and transferred to -80°C after completion of the culture run. IgG titer and metabolites were monitored by Cedex™ Bio (Roche).
Automated one-step purification
Purification of day 3–11 mAb samples and harvest samples were evaluated on HiTrap Fibro PrismA (0.4 mL unit) and HiTrap MabSelect PrismA (1 mL column) run on an ÄKTA pure system with attached Teledyne ASX-560 autosampler (Teledyne CETAC Technologies) (Fig 10). The protocols for protein A purification used for the Fibro and column runs are listed in Table 2.
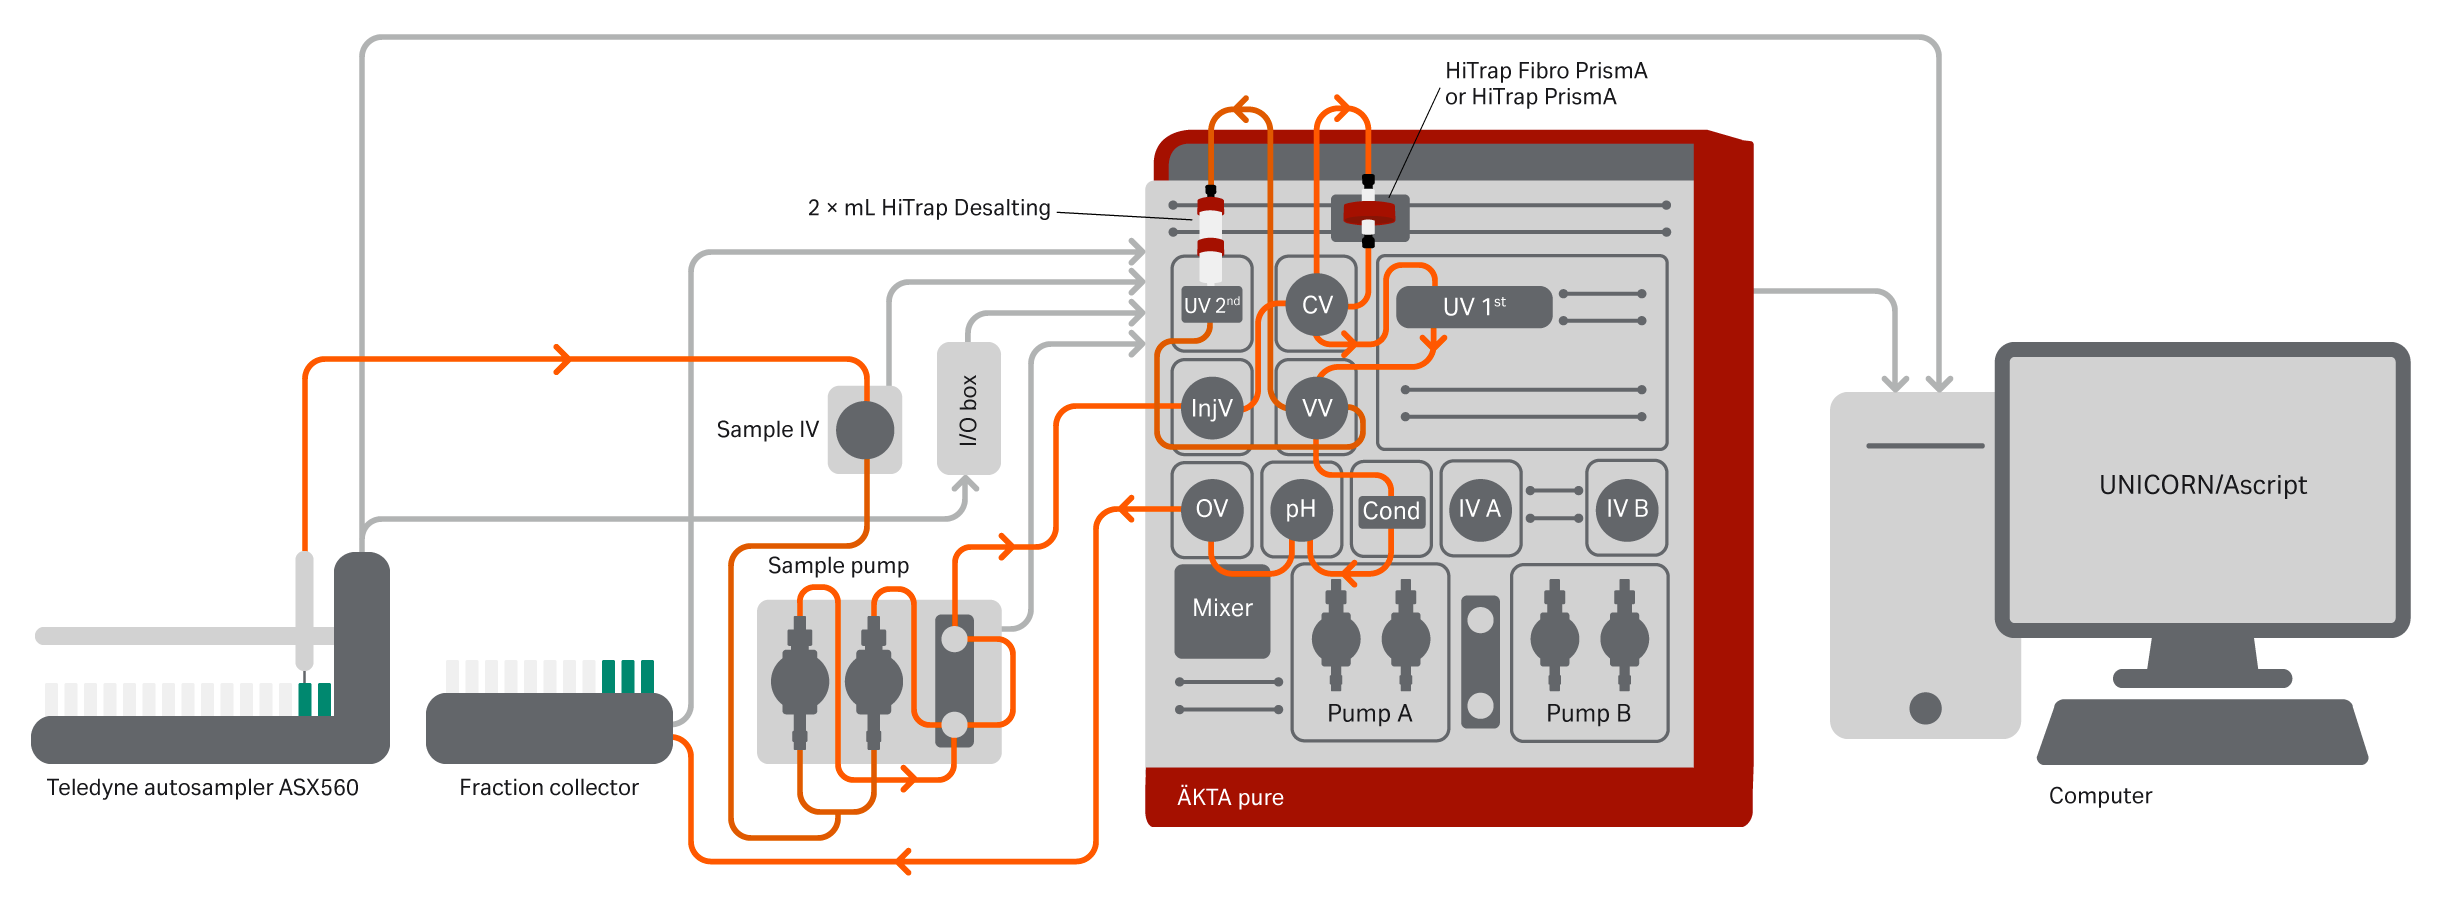
Fig 10. ÄKTA pure system configured for automatic one- and two-step purification schemes. Additional components are a versatile valve and LED UV. The schematic also shows the connected Teledyne autosampler ASX-560, which uses the sample pump for injections. When the first UV sees an eluting peak from the HiTrap Fibro PrismA unit a watch function initiates, turning the versatile valve so that the peak is directed to the 2× HiTrap Desalting columns. The flow will then pass the second UV, the conductivity monitor, and via the outlet valve to the fraction collector. The autosampler was connected via the I/O box using a custom-made cable for matching the input and output signals. The digital output I/O box signals were initially set to 0 for all outputs. The ASX-560 is connected to a host computer using a USB interface. It is controlled using AScript software (v1.5) (Teledyne Technologies Inc), and the software and autosampler actions are initiated by the digital output signals programmed in the UNICORN method.
Table 2. Protocols for protein A purification
| HiTrap Fibro PrismA | HiTrap MabSelect PrismA | |
| Equilibration | 16 mL/min 20 mM phosphate, 150 mM NaCl, pH 7.4, 6 mL (auto zero UV) | 1 mL/min 20 mM phosphate, 150 mM NaCl, pH 7.4, 4 mL |
| Sample load | 16 mL/min 5 mL or 3 mL based on titer | 0.5 mL/min 5 mL or 3 mL based on titer |
| Wash | 16 mL/min 20 mM phosphate, 150 mM NaCl, pH 7.4, 6 mL | 0.5 mL/min 20 mM phosphate, 150 mM NaCl, pH 7.4, 1.5 mL |
| Elution | 4 mL/min 50 mM acetate, pH 3.5, 6 mL Collect eluate based on UV (start level 20 mAU, end level 100 mAU) | 1 mL/min 50 mM acetate, pH 3.5, 4 mL Collect eluate based on UV (start level 20 mAU, end level 100 mAU) |
| Two-step CIP | 16 mL/min 1. 1 M NaOH, 16 mL (up flow) 2. 20 mM phosphate, 150 mM NaCl, pH 7.4, 8 mL (up flow) | 1. 1 mL/min 3 CV 20 mM phosphate, 150 mM NaCl, pH 7.4 (down flow) 2. 0.3 mL/min 4.5 CV (mL) 1 M NaOH (15 min) (down flow) |
| Re-equilibration | 16 mL/min 20 mM phosphate, 150 mM NaCl, pH 7.4, 12 mL | 1 mL/min 20 mM phosphate, 150 mM NaCl, pH 7.4, 5 mL |
| Autosampler CIP sample inlet | 1 M NaOH | 1 M NaOH |
| Autosampler wash sample inlet | 20 mM phosphate, 150 mM NaCl, pH 7.4 | 20 mM phosphate, 150 mM NaCl, pH 7.4 |
Automated two-step purification
In this study we used an autosampler from Teledyne Cetac Technologies (ASX-560), which allows for loading of various larger sample volumes (up to several hundred mL).
Further, an automated two-step tandem purification of mAb feed samples was set up on an ÄKTA pure system. The system was also equipped with a versatile valve (V9-V) and an LED-UV (280 nm, V9-L) placed between the multiple wavelength UV (U9-M) and the conductivity monitor (U9-C). The captured peak from a HiTrap Fibro PrismA unit or from a HiTrap MabSelect PrismA column was directed automatically for buffer exchange to appropriate buffer conditions using 2 × 5 mL HiTrap Desalting columns. This is achieved by programming the UNICORN software with a watch function on the UV level (50 mAU), which sends a command to turn the versatile valve directing the eluate from the Fibro unit or column directly to the two 5 mL HiTrap Desalting columns connected in series.
The purification protocol for the first step was the same as the protocol for the one-step purification (Table 2). The protocol for the second step is shown in Table 3. A schematic view and details of the UNICORN two-step method are shown in Figure 11.
Table 3. Protocols for buffer exchange
| 2 × 5 mL HiTrap Desalting for buffer exchange | |
| Equilibration | 10 mL/min 10 mM HEPES, 150 mM NaCl, pH 7.4, 15 mL (fill system) |
| Sample load | Loading the eluting peak from step one. Programmed as a watch function allowing turning the versatile valve. |
| Elution | 10 mL/min 10 mM HEPES, 150 mM NaCl, pH 7.4, 15 mL (fill system) |
| CIP | 5 mL/min 1 CV 2 min (down flow) 0.1 M NaOH |
| Re-equilibration | 10 mL/mL 2 CV 10 mM HEPES, 150 mM NaCl, pH 7.4 (down flow) |
| Autosampler CIP sample inlet | 1 M NaOH |
| Autosampler wash sample inlet | 20 mM phosphate, 150 mM NaCl, pH 7.4 |
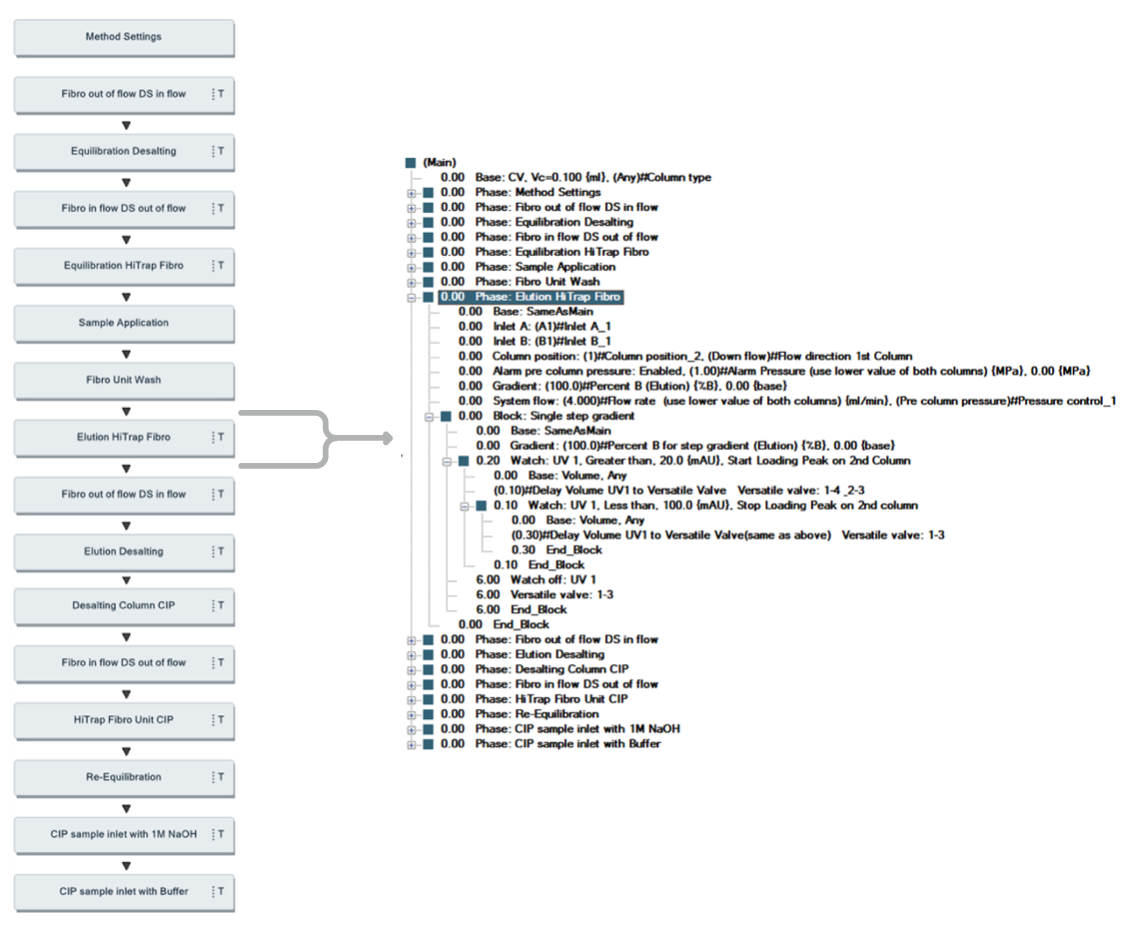
Fig 11. UNICORN method and details for programming watch function for direct load onto the second chromatography step.
SDS-PAGE analysis for carryover analysis
To check for carryover between runs of different samples, blank runs were performed with buffer after the protein A step. Samples were labeled with Cy5 dye then subjected to SDS-PAGE analysis.
Charge variants profile
CIEX was performed on a ProPac™ WCX-10 2x250 mm column (Thermo Fisher) on an Agilent™ 1290 UPLC system with OpenLab™ software (Agilent). Approximately 40 µg sample was injected onto the column. Buffer A was 2.5 mM Tris, 10 mM NaH2PO4 × H2O, pH 6.5–6.6. Buffer B was 2 mM Tris, 10 mM Na2HPO4 × 2 H2O, pH 9.5–9.6.
Aggregate and fragments profile
SEC was performed on a Superdex 200 Increase 10/300 GL on an Agilent 1290 UPLC system with OpenLab. Approximately 40 µg sample was injected onto the column. The buffer was 200 mM phosphate, pH 6.8.
Multi-attribute monitoring–mass spectrometry (MAM-MS)
The HiTrap Fibro PrismA and HiTrap MabSelect PrismA purified mAb samples were reduced, alkylated, and enzymatically digested using trypsin for 4 hours at 37°C. The digestion was quenched by acidifying the samples with formic acid, and the peptides were analyzed by LC-MS/MS in all ions mode using an AdvanceBio Peptide Map 2.1 x 150 mm 2.7-Micron column (Agilent) over an Agilent 1290 Infinity™ II UPLC coupled to a 6550 iFunnel™ Q-TOF LC/MS (Agilent). The LC-MS/MS profiles for mAb samples captured with a Fibro unit or a column were compared in a correlation plot using the Agilent MS Profiler software. The most abundant N-glycosylation profiles (G0F and G1F) were quantitatively compared for the same samples using the Agilent MS Quant software.
The N-linked glycosylation profile is one of the most important PQAs to monitor and control, as N-glycosylations have large biological and immunogenic effects. The most abundant N-glycosylations of human IgG expressed in CHO cells, G0F and G1F, were measured by the MAM-MS method from samples taken daily over the cell culture and captured by either Fibro PrismA or MabSelect PrismA.